. 2006 Jul;26(14):5284-99.
doi: 10.1128/MCB.00105-06.

Wnt activation and alternative promoter repression of LEF1 in colon cancer

Affiliations

Wnt activation and alternative promoter repression of LEF1 in colon cancer

Tony W-H Li et al. Mol Cell Biol. 2006 Jul.

Abstract

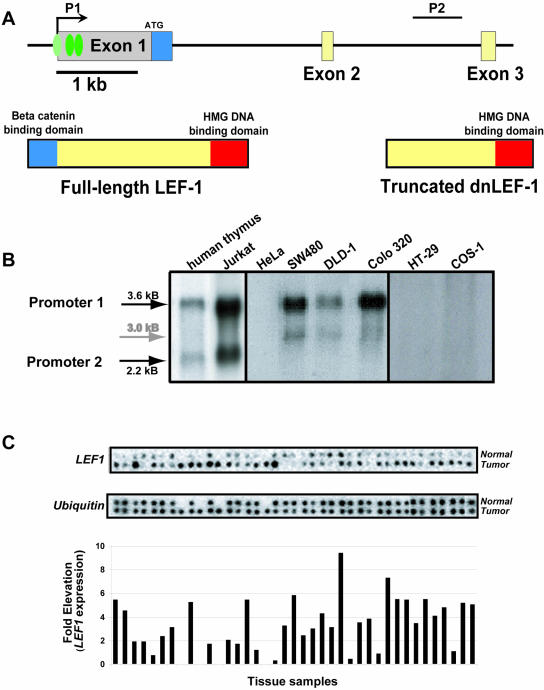
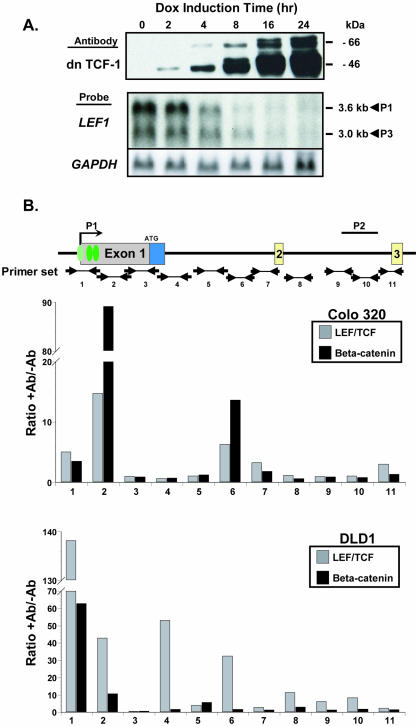
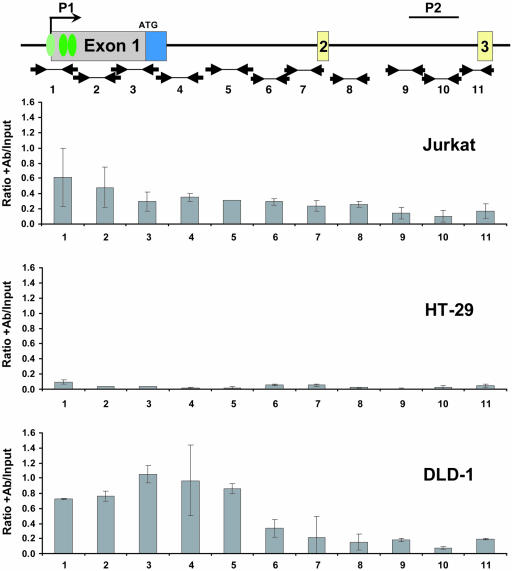
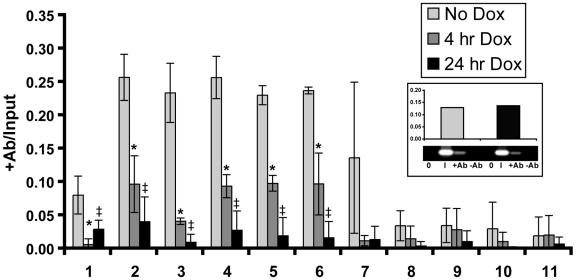
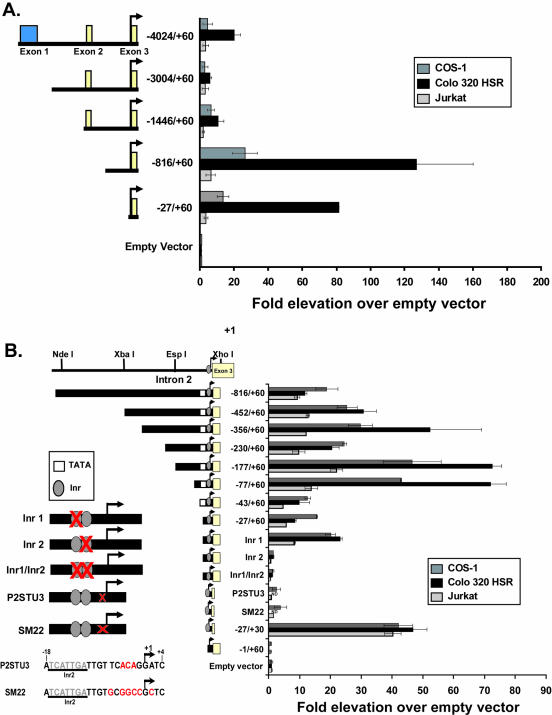
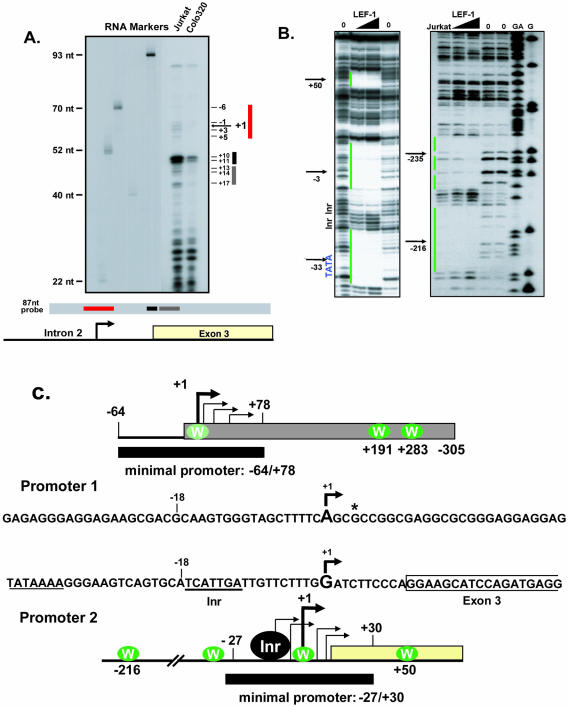
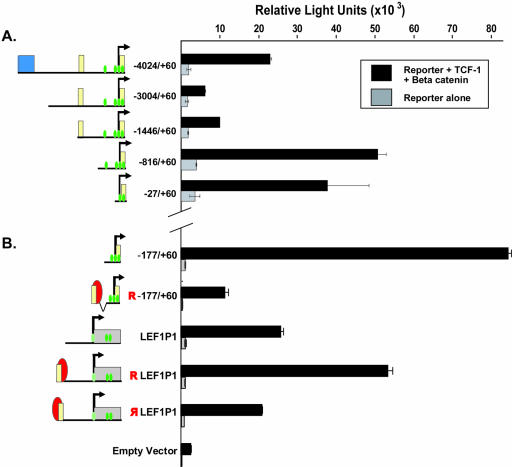
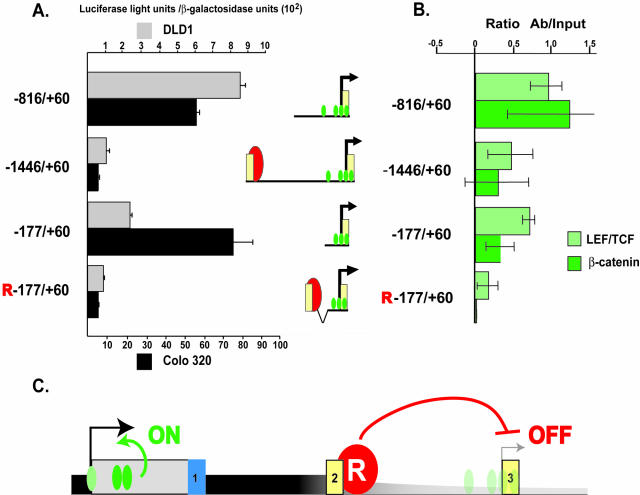
Alternative promoters within the LEF1 locus produce polypeptides of opposing biological activities. Promoter 1 produces full-length LEF-1 protein, which recruits beta-catenin to Wnt target genes. Promoter 2 produces a truncated form that cannot interact with beta-catenin and instead suppresses Wnt regulation of target genes. Here we show that promoter 1 is aberrantly activated in colon cancers because it is a direct target of the Wnt pathway. T-cell factor (TCF)-beta-catenin complexes bind to Wnt response elements in exon 1 and dynamically regulate chromatin acetylation and promoter 1 activity. Promoter 2 is delimited to the intron 2/exon 3 boundary and, like promoter 1, is also directly regulated by TCF-beta-catenin complexes. Promoter 2 is nevertheless silent in colon cancer because an upstream repressor selectively targets the basal promoter leading to destabilized TCF-beta-catenin binding. We conclude that the biological outcome of aberrant LEF1 activation in colon cancer is directed by differential promoter activation and repression.


Figures

FIG. 1.
FIG. 1.
LEF1 expression in colon cancer lines and primary tissue. (A) LEF1 promoter 1 produces a 3.6-kb mRNA encoding full-length LEF-1 protein with a β-catenin binding domain at the N terminus (blue box) and an HMG (high mobility group) DNA binding/bending domain near the C terminus (red box). Green ovals near the transcription start site of promoter 1 depict LEF/TCF binding sites at −14, +191, and +283. An undefined second promoter (P2) in the second intron produces a 2.2-kb mRNA encoding a truncated polypeptide that lacks the β-catenin binding domain (dnLEF-1). (B) Northern blot of LEF1 expression in the cancer cell lines used in this study. In addition to the 3.6-kb and 2.2-kb messages, a minor 3.0-kb mRNA is produced from a third promoter in exon 1 (13, 21), which also encodes full-length LEF-1. The 2.2-kb message is detected only in the human thymus and Jurkat (human T-lymphocyte) samples. Other cell lines shown are HeLa (human cervical carcinoma); SW480, DLD1, Colo 320, and HT-29 (human colon cancer); and COS-1 (monkey kidney). (C) A cancer profiling array containing matched cDNA samples of primary colon carcinoma and adjacent normal colon tissue from 35 different patients was probed with 32P-labeled 1.1-kb cDNA from the LEF1 open reading frame. Elevation calculations (n-fold; shown below each matched set as a bar) represent the ratios of the signal intensities of the tumor samples over those of the normal samples. Signal intensities were prenormalized using the ubiquitin hybridization signals.
FIG. 2.
FIG. 2.
FISH analysis of the LEF1 locus in human colon cancer cell lines. Fluorescence in situ hybridization analysis was performed with normal human fibroblast cells (A) and with three human colon cancer cell lines (Colo 320, SW480, and HT-29 are shown in panels Β to D, respectively). The red hybridization signal indicates detection of the LEF1 gene with rhodamine-conjugated antidigoxigenin antibodies and a digoxigenin-labeled genomic LEF1 probe. The green signal in the normal fibroblast cells (panel A) identifies centromeric DNA. The green signal in all three colon cancer cell lines derives from a chromosome 4-specific paint probe. All panels show that the LEF1 gene is diploid and located on chromosome 4. The HT-29 panel (D) shows the additional staining of a partial chromosome 4 with a LEF1 signal.
FIG. 3.
FIG. 3.
LEF1 is a direct Wnt target in colon cancer cells. (A) DLD1 colon cancer cells modified to stably induce dnTCF-1 upon addition of doxycycline (Dox; an analog of tetracycline) to the media were induced for the times indicated. Western blots of extracts from these cells show dnTCF-1 expression starting after 2 h of doxycycline treatment. Northern blot analysis of endogenous LEF1 mRNA (both the 3.6- and 3.0-kb messages are produced in DLD1 cells) shows rapid inhibition of LEF1 expression starting at 4 h, whereas GAPDH expression remains unchanged. (B) Eleven oligonucleotide primer sets were used to survey TCF/LEF and β-catenin occupancy along 5.5 kb between promoter 1 and promoter 2 in ChIP assays of Colo 320 and DLD1 colon cancer cells (promoter 2 is not active). Each primer set covers 300 to 500 nucleotides of LEF1 sequence. PCR products from the immunoprecipitates were obtained using amplification conditions in the linear range (data not shown). Each bar represents the ratio of the signal intensities of the PCR-amplified products (+Ab) from pan-LEF/TCF antibody (gray bars) or β-catenin antibody (black bars) over that derived from normal IgG control antibody immunoprecipitations (−Ab). The experiment shown is representative of four independent experiments. See the legend to Fig. 1 for an explanation of other colors and shapes.
FIG. 4.
FIG. 4.
Acetylation profiles of LEF1 P1 and P2. Antibody to acetylated histone H3 was used in chromatin immunoprecipitation assays with Jurkat extracts (both promoters are active), HT-29 extracts (both promoters are inactive), and DLD1 extracts (only P1 is active). The bars represent the ratios of immunoprecipitated product over the total amount of product present in the input. Data from three independent experiments were used to generate the graph such that the bars depict average values and error bars depict the standard deviation. See the legend to Fig. 1 for an explanation of other colors and shapes.
FIG. 5.
FIG. 5.
Chromatin acetylation of LEF1 P1 requires dynamic association of β-catenin. Chromatin immunoprecipitation analysis of a modified DLD1 colon cancer cell line that can overexpress dnTCF-1 upon induction with doxycycline (Dox) (43) was used to assess acetylated histone H3 levels in uninduced cells (light-gray bars) compared to levels in cells treated with doxycycline for 4 h and 24 h (dark-gray and black bars, respectively). Data represent the ratios of immunoprecipitated product over the total amount of product present in the input. The inset shows the results of a ChIP analysis of histone H3 acetylation over the GAPDH promoter region in the same experiment, with an agarose gel of the PCR products shown below. These experiments were repeated three times with similar results. Results shown are the means of two independent experiments. A Student t test was used to calculate statistical significance (*, P < 0.03; ‡, P < 0.01).
FIG. 6.
FIG. 6.
Basal LEF1 promoter 2 is a TATA-less promoter near exon 3 and is highly active in colon cancer cells. (A) Transient transfections of the indicated promoter 2 reporter plasmids (pGL2; no enhancer) into COS-1, Colo 320, and Jurkat cells. Luciferase activity is reported as elevation (n-fold) over that for a promoterless reporter vector, with error bars representing standard deviations of the results from three independent transfections. In all three cell lines, small promoter 2 fragments (−27/+60 and −816/+60) exhibit activity levels higher than those of fragments with upstream sequences from −816 to −1446 (intron 2/exon 2). (B) To map basal P2, the indicated promoter fragments were subcloned into the SV40 enhancer-containing pGL2E vector and tested in Jurkat T cells (promoter 2 active), Colo 320 colon cancer cells (promoter 2 silent), and COS-1 green monkey kidney cells (no LEF1 expressed). The SV40 enhancer masks the colon cancer-specific activity of the promoter. All three cell lines show similar trends in basal promoter activity with a minimal promoter from −27 to +30. A TATAAA sequence (white box) 33 nucleotides upstream of the transcription start site can be deleted without affecting basal promoter activity in any of the three cell lines. This element is loosely conserved in mouse and rat genomes (TGTAAA) and is therefore either a nonfunctional basal element or an alternative TATA box used in situations not probed in these experiments. Within the minimal 57-nucleotide promoter fragment (−27/+30), two sequence motifs share similarity to Initiator elements (gray oval; YYANWYY [36]). The second Inr motif is essential for promoter activity, as a three-nucleotide change abolishes promoter activity (Inr2), whereas an identical mutation of the first initiator motif has no effect (Inr1). Transcription start site mutations (P2STU3 and SM22; nucleotide changes shown in red to the left of the bar graph) attenuate basal activity of the promoter. See the legend to Fig. 1 for an explanation of other colors and shapes. ND, not determined.
FIG. 7.
FIG. 7.
Identification of promoter 2 transcription start sites and LEF/TCF binding sites. (A) RNase protection analysis of promoter 2 was performed using total RNA from Jurkat T cells (promoter 1 and 2 active) and Colo 320 HSR colon cancer cells (only promoter 1 active). The labeled probe used for this assay is complementary to 50 nucleotides (nt) of exon 3 and 37 nucleotides of intron 2 (gray bar) and includes 60 nucleotides of pBluescript vector sequence (not shown). Product sizes of 66, 61, 60, 57, and 55 nucleotides were detected only in the Jurkat lane, indicating that these products were derived from promoter 2 mRNA (red bar). These products correspond to transcription start sites at −6, −1, +1, +3, and +5. The start sites are likely to be authentic, since a three-nucleotide substitution at positions −2 to −4 relative to +1 abolishes all promoter activity (Fig. 6B). Therefore, we have assigned +1 to represent the position 10 nucleotides upstream of the exon 3 boundary and consider P2 to be a TATA-less, Inr-driven promoter. Major protected products corresponding to +10 and +11 derive from promoter 1 mRNA and are present in both Jurkat and Colo 320 lanes (black bar). (B) LEF/TCF binding sites near P2. Footprint analysis of P2 with recombinant LEF-1 protein shows binding activity at −3 near the transcription start site, upstream at −33, and downstream at +50. A single footprint is identified upstream at −216, with a weaker site nearby at −235. (C) A comparison of sequence and start sites of promoter 1 and promoter 2. * marks a transcription start site mapped by Filali et al. (13). Green ovals mark LEF/TCF binding sites as potential Wnt response elements.
FIG. 8.
FIG. 8.
Promoter 2 regulation by TCF-β-catenin and repression by upstream sequences. (A) The same promoter 2 reporter constructs shown in Fig. 6A (enhancerless pGL2 vector backbone) were cotransfected with expression vectors for TCF-1 and β-catenin in COS-1 cells. LEF/TCF binding sites (WREs) are shown by green ovals. Data are reported as relative light units with respect to values for empty, promoterless vector and are representative of four experiments. Error bars represent the variances between duplicate samples. Note that activation of promoter 2 by TCF-β-catenin is reduced in the presence of upstream sequences (−1446 and beyond). (B) A 165-nucleotide repressor region (red oval) strongly represses TCF-β-catenin activation of P2 but not of P1 in COS-1 transient transfections. The upstream 165-nucleotide region (depicted by a red oval and a red “R”) can strongly repress promoter 2 (−1446/+60, R-177/+60) but not promoter 1 in either orientation (the reversed “R” indicates the opposite orientation). The repressor region prevents coexpressed TCF-β-catenin complexes from activating promoter 2 in Cos-1 cells but does not affect activation of promoter 1. Data are reported as means of three replicate experiments and error bars represent the standard deviations. See the legend to Fig. 1 for an explanation of other colors and shapes.
FIG. 9.
FIG. 9.
Analysis of promoter 2 activity, repressor function, and TCF-β-catenin occupancy in stable cell lines. (A) Four stable cell lines were created in two different colon cancer cell lines (DLD1, Colo 320) by transfecting the four indicated promoter 2 luciferase reporter plasmids. Stable cell lines consist of pools of stable integrants that were expanded together and analyzed for luciferase activity. Activities were normalized (shown as a ratio) with β-galactosidase activities derived from an independent cotransfected plasmid that also integrated into the genome. The data are represented as ratios of luciferase light units to β-galactosidase units, and the error bars reflect standard deviations from three independent determinations. (B) The stable DLD1 cell lines were analyzed by chromatin immunoprecipitation analysis for TCF and β-catenin binding to the promoter 2 region of the integrated reporter plasmids. Results are the means of two independent experiments, and they show that promoter 2 fragments without the repressor region are highly active in colon cancer cells and are occupied by TCF-β-catenin complexes. Activity and TCF-β-catenin occupancy are greatly inhibited when the 165-nucleotide repressor region is present. (C) A model depicting the data shown in this study. Promoter 1 is expressed in colon cancer cells because TCF-β-catenin complexes occupy Wnt response elements and activate the promoter (green ovals and arrow). Acetylation (shown as a black bar) is dependent upon β-catenin binding, but levels drop near exon 2 and remain at a low, consistent level through exon 3. Promoter 2, which has Wnt response elements (shown as faded green ovals), is silent in colon cancer because an upstream repressor directly inhibits a basal promoter function and disallows TCF-β-catenin occupancy. See the legend to Fig. 1 for an explanation of other colors and shapes.

Similar articles

Cited by

References

    1. Aoki, M., A. Hecht, U. Kruse, R. Kemler, and P. K. Vogt. 1999. Nuclear endpoint of Wnt signaling: neoplastic transformation induced by transactivating lymphoid-enhancing factor 1. Proc. Natl. Acad. Sci. USA 96:139-144. - PMC - PubMed
    1. Aoki, M., V. Sobek, D. J. Maslyar, A. Hecht, and P. K. Vogt. 2002. Oncogenic transformation by beta-catenin: deletion analysis and characterization of selected target genes. Oncogene 21:6983-6991. - PubMed
    1. Atcha, F. A., J. E. Munguia, T. W. Li, K. Hovanes, and M. L. Waterman. 2003. A new beta-catenin-dependent activation domain in T cell factor. J. Biol. Chem. 278:16169-16175. - PubMed
    1. Barker, N., A. Hurlstone, H. Musisi, A. Miles, M. Bienz, and H. Clevers. 2001. The chromatin remodelling factor Brg-1 interacts with beta-catenin to promote target gene activation. EMBO J. 20:4935-4943. - PMC - PubMed
    1. Batlle, E., J. T. Henderson, H. Beghtel, M. M. van den Born, E. Sancho, G. Huls, J. Meeldijk, J. Robertson, M. van de Wetering, T. Pawson, and H. Clevers. 2002. β-Catenin and TCF mediate cell positioning in the intestinal epithelium by controlling the expression of EphB/EphrinB. Cell 111:251-263. - PubMed

Publication types

MeSH terms

LinkOut - more resources