. 2006 Jul;26(14):5449-69.
doi: 10.1128/MCB.02074-05.

Cyclin D1 determines mitochondrial function in vivo

Affiliations

Cyclin D1 determines mitochondrial function in vivo

Toshiyuki Sakamaki et al. Mol Cell Biol. 2006 Jul.

Abstract

The cyclin D1 gene encodes a regulatory subunit of the holoenzyme that phosphorylates and inactivates the pRb tumor suppressor to promote nuclear DNA synthesis. cyclin D1 is overexpressed in human breast cancers and is sufficient for the development of murine mammary tumors. Herein, cyclin D1 is shown to perform a novel function, inhibiting mitochondrial function and size. Mitochondrial activity was enhanced by genetic deletion or antisense or small interfering RNA to cyclin D1. Global gene expression profiling and functional analysis of mammary epithelial cell-targeted cyclin D1 antisense transgenics demonstrated that cyclin D1 inhibits mitochondrial activity and aerobic glycolysis in vivo. Reciprocal regulation of these genes was observed in cyclin D1-induced mammary tumors. Cyclin D1 thus integrates nuclear DNA synthesis and mitochondrial function.


Figures
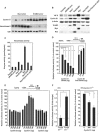
FIG. 1.
FIG. 1.
Cyclin D1 inhibits hexokinase II abundance, enzyme activity, and promoter activity. (A) Western blot analysis of mammary epithelium from tumors of MMTV-Myc or MMTV-ErbB2 transgenic mice for cyclin D1 and hexokinase II, with the loading control GDI. (B) Western blot analysis of MCF10A cells transduced with vectors encoding NeuT, Ras and ErbB2, or Myc. The NeuT-transduced MCF10A cells were transduced with an expression vector for cyclin D1-IRES GFP or control IRES-GFP vector. (C) Hexokinase II enzymatic activity was determined using equal amounts of cell extracts of the corresponding cells in panel B. (D) Luciferase activity of the hexokinase II promoter was determined in the MMT-ErbB2-mammary tumor-derived cell line, NAFA. Data are shown for the effect of cotransfected cyclin D1 plasmid compared with equal amounts of empty vector as means ± SEM (formula image, P < 0.05; n = 10). (E) Luciferase activity of hexokinase II promoter in response to cyclin D3, cyclin A, and cyclin E in transfected NAFA cells. Data are compared to relevant empty vector and displayed as means ± SEM (n = 4). (F) Hexokinase II promoter activity was assessed in either 3T3 cells, cyclin D1−/ 3T3 cells, or cyclin D1−/ 3T3 cells with transfected cyclin D1 expression plasmid, in each case normalized to Renilla luciferase or β-galactosidase activity, as means ± SEM (formula image, P < 0.05; n ≥ 20). HK II, hexokinase II.
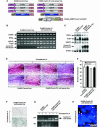
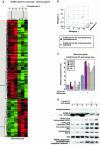
FIG. 2.
FIG. 2.
Inducible mammary epithelial cell-targeted cyclin D1 antisense transgene expression in vivo. (A) Schematic representation of ponasterone-inducible cyclin D1 antisense-ErbB2 transgenes (right panel) and “ErbB2-control line” (left panel). CMV, cytomegalovirus. (B) PCR analysis and (C) genomic Southern blot of transgenes integrated into transgenic mice lines. (D) Mammary gland squashes of separate transgenic mice treated with either placebo or ponasterone A pellets. (E) Quantification of mammary gland branch numbers is shown for n = 3 separate transgenic mice in each group. (F) β-Galactosidase expression in mammary glands of cyclin D1 antisense lines treated with either placebo or ponasterone A pellets. (G) RT-PCR analysis of mammary epithelium from control or cyclin D1 antisense mice treated with ponasterone A. (H) FISH of mammary epithelium from cyclin D1 antisense-ErbB2 transgenic mice treated with ponasterone A. Single cells are shown with arrows indicating the presence of cyclin D1 antisense transgenic transcript. b-gal, β-galactosidase; A/S, antisense.
FIG. 3.
FIG. 3.
Cyclin D1 antisense induces hexokinase II and genes governing oxidative glycolysis and mitochondrial function in vivo. (A) Treeview display of microarray expression data comparing mammary epithelium of ponasterone A- or placebo pellet-treated cyclin D1 antisense/ErbB2 transgenics. Levels of expression are shown for upregulated genes (red) and downregulated genes (green). Raw gene expression data and gene names and accession numbers are shown at http://www.jci.tju.edu/pestell/papers/CD1AS (worksheet labeled “252 genes”). (B) Pearson correlation coefficient analysis of ponasterone A- or placebo pellet-treated ErbB2-cyclin D1 antisense transgenics. Separation of gene groups by metagene analysis is shown for transgenic mice treated with either ponasterone A or placebo. (C) The relative abundance of proteins determined in panel D is shown. (D) Western blot analysis of mammary epithelium from cyclin D1 antisense/ErbB2 transgenics that were treated either with placebo (−) or ponasterone A (+), with antibodies for the indicated proteins. Fatty acid synthase (FAS) (lipogenic gene), acetyl-CoA carboxylase (ACC), hexokinase II (HK II) (glycolytic gene), and pyruvate kinase (PK), together with mtDNA-encoded NADH:ubiquinone oxidoreductase (complex I) subunit 1 and a control for loading (GDI), are shown.
FIG. 4.
FIG. 4.
Cyclin D1 antisense-regulated genes in vivo. A schematic representation is shown of gene products regulating mitochondrial function and lipogenesis. Genes that are induced by mammary epithelial cell-targeted cyclin D1 antisense, assessed by gene expression profiling, are shown in red arrows (↑); those repressed are shown in blue arrows (↓). **, genes regulated reciprocally in MMTV-cyclin D1 mammary tumors. TCA, tricarboxylic acid; FAD, flavin adenine dinucleotide; FADH2, reduced FAD; DHCR, 7-dehydrocholesterol reductase; GAPDH, glyceraldehyde-3-phosphate dehydrogenase; PEPCK, phosphoenolpyruvate carboxykinase.
FIG. 5.
FIG. 5.
Molecular signature from cyclin D1-induced mammary epithelial tumors—inhibition of lipogenesis, glycolysis, and mitochondrial gene function. (A) Treeview analysis of microarray expression data comparing mammary tumors derived from MMTV-cyclin D1 transgenic mice showing genes regulated more than twofold. Levels for expression are shown for either up-regulated genes (red) or down-regulated genes (green). See http://www.jci.tju.edu/pestell/papers/CD1AS (worksheet labeled “31 genes”) for the gene accession numbers and names. Genes that are regulated reciprocally to mammary epithelial cell-targeted cyclin D1 antisense are indicated by gene names in red with the gene product names in parentheses. These genes regulate mitochondrial metabolism and lipogenesis. (B) Pearson correlation coefficient analysis. Separation of gene groups by metagene analysis is shown for transgenic mice treated with either ponasterone A, placebo, or MMTV-cyclin D1 tumors.
FIG. 6.
FIG. 6.
Cyclin D1 antisense enhances mammary epithelial cell mitochondrial activity. (A) The primary cultures of mammary epithelium from cyclin D1 antisense-ErbB2 transgenic mice were treated with either vehicle (−) or ponasterone A (+) (10 μM) for 48 h and assessed by (left) real-time RT-PCR or (right) Western blotting. (B) MitoTracker activity of cyclin D1 antisense-ErbB2 transgenic epithelium versus “ErbB2 control line” transgenic mice (Fig. 2A) assessed in situ and quantitated by fluorescence-activated cell sorter analysis (C). DDCt, ΔΔ cycle threshold; FL2, filter that detects fluorescence at 599 nm; Pon A, ponasterone A.
FIG. 7.
FIG. 7.
Cyclin D1 inhibits breast epithelial tumor cell mitochondrial activity. (A) The NAFA cell line infected with the cyclin D1 antisense retrovirus vector (mouse stem cell virus-cyclin D1 antisense-IRES-GFP) was analyzed by Western blotting for cyclin D1 with GDI used as a loading control for protein. (B) Northern blot analysis for cyclin D1 sense and anti-sense mRNA. (C) The relative change in MitoTracker activity (shown for representative experiments for n ≥ 3). (D) Western blot analysis of MCF7 cells 72 h after transduction with control or cyclin D1 siRNA. (E) Mitochondrial activity determined by MitoTracker at 72 h. (F) Western blot time course analysis of MCF7 cells after transduction with control or cyclin D1 siRNA and (G) corresponding MitoTracker activity. (H) Hexokinase activity of MCF7 cells treated with cyclin D1 siRNA. FL2, filter that detects fluorescence at 599 nm.
FIG. 8.
FIG. 8.
Cyclin D1 deletion increases breast epithelial cell expression of proteins regulating glycolysis, lipogenesis, and mitochondrial size. (A) Western blot analysis of mammary epithelium from wt or cyclin D1−/ mice with antibodies for the indicated proteins. Fatty acid synthase (FAS) (lipogenic gene), acetyl-CoA carboxylase (ACC), hexokinase II (HK II) (glycolytic gene), pyruvate kinase (PK) and a control for loading (GDI) are shown. (B) Transmission electron microscopic images of mammary epithelial cells of wt or cyclin D1−/ mice, showing increased mitochondrial size in cyclin D1−/ mice (scale bar = 1 μm). N, nucleus; arrows, mitochondria. (C) Mouse mammary gland spectroscopy. Thin-line spectra were obtained from cyclin D1−/ mouse mammary gland in vivo. Bold-line spectra were obtained from normal mouse mammary gland in vivo.

References

    1. Albanese, C., M. D'Amico, A. T. Reutens, M. Fu, G. Watanabe, R. J. Lee, R. N. Kitsis, B. Henglein, M. Avantaggiati, K. Somasundaram, B. Thimmapaya, and R. G. Pestell. 1999. Activation of the cyclin D1 gene by the E1A-associated protein p300 through AP-1 inhibits cellular apoptosis. J. Biol. Chem. 274:34186-34195. - PubMed
    1. Albanese, C., J. Hulit, T. Sakamaki, and R. G. Pestell. 2002. Recent advances in inducible expression in transgenic mice. Semin. Cell Dev. Biol. 13:129-141. - PubMed
    1. Albanese, C., A. T. Reutens, B. Bouzahzah, M. Fu, M. D'Amico, T. Link, R. Nicholson, R. A. Depinho, and R. G. Pestell. 2000. Sustained mammary gland-directed, ponasterone A-inducible expression in transgenic mice. FASEB J. 14:877-884. - PubMed
    1. Albanese, C., K. Wu, M. D'Amico, C. Jarrett, D. Joyce, J. Hughes, J. Hulit, T. Sakamaki, M. Fu, A. Ben-Ze'ev, J. F. Bromberg, C. Lamberti, U. Verma, R. B. Gaynor, S. W. Byers, and R. G. Pestell. 2003. IKKalpha regulates mitogenic signaling through transcriptional induction of cyclin D1 via Tcf. Mol. Biol. Cell 14:585-599. - PMC - PubMed
    1. Alizadeh, A. A., M. B. Eisen, R. E. Davis, C. Ma, I. S. Lossos, A. Rosenwald, J. C. Boldrick, H. Sabet, T. Tran, X. Yu, J. I. Powell, L. Yang, G. E. Marti, T. Moore, J. Hudson, Jr., L. Lu, D. B. Lewis, R. Tibshirani, G. Sherlock, W. C. Chan, T. C. Greiner, D. D. Weisenburger, J. O. Armitage, R. Warnke, R. Levy, W. Wilson, M. R. Grever, J. C. Byrd, D. Botstein, P. O. Brown, and L. M. Staudt. 2000. Distinct types of diffuse large B-cell lymphoma identified by gene expression profiling. Nature 403:503-511. - PubMed

Publication types

MeSH terms

LinkOut - more resources