DFT analysis of co-alkyl and co-adenosyl vibrational modes in B12-cofactors
- PMID: 16813422
- PMCID: PMC2773831
- DOI: 10.1021/ic052069j
DFT analysis of co-alkyl and co-adenosyl vibrational modes in B12-cofactors
Abstract
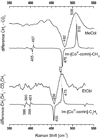
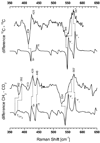
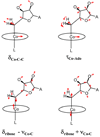
Density functional theory (DFT)-based normal mode calculations have been carried out on models for B12-cofactors to assign reported isotope-edited resonance Raman spectra, which isolate vibrations of the organo-Co group. Interpretation is straightforward for alkyl-Co derivatives, which display prominent Co-C stretching vibrational bands. DFT correctly reproduces Co-C distances and frequencies for the methyl and ethyl derivatives. However, spectra are complex for adenosyl derivatives, due to mixing of Co-C stretching with a ribose deformation coordinate and to activation of modes involving Co-C-C bending and Co-adenosyl torsion. Despite this complexity, the computed spectra provide a satisfactory re-assignment of the experimental data. Reported trends in adenosyl-cobalamin spectra upon binding to the methylmalonyl CoA mutase enzyme, as well as on subsequent binding of substrates and inhibitors, provide support for an activation mechanism involving substrate-induced deformation of the adenosyl ligand.
Figures


Similar articles
-
A combined density functional theory and molecular mechanics study of the relationship between the structure of coenzyme B12 and its binding to methylmalonyl-CoA mutase.J Am Chem Soc. 2004 Feb 25;126(7):1928-9. doi: 10.1021/ja028473o. J Am Chem Soc. 2004. PMID: 14971913
-
Biochemistry of B12-cofactors in human metabolism.Subcell Biochem. 2012;56:323-46. doi: 10.1007/978-94-007-2199-9_17. Subcell Biochem. 2012. PMID: 22116707 Review.
-
Computational insights into the mechanism of radical generation in B12-dependent methylmalonyl-CoA mutase.J Am Chem Soc. 2006 Feb 1;128(4):1287-92. doi: 10.1021/ja056333j. J Am Chem Soc. 2006. PMID: 16433547
-
Mirror "base-off" conformation of coenzyme B12 in human adenosyltransferase and its downstream target, methylmalonyl-CoA mutase.J Am Chem Soc. 2005 Jan 19;127(2):526-7. doi: 10.1021/ja044365l. J Am Chem Soc. 2005. PMID: 15643868
-
Radical carbon skeleton rearrangements: catalysis by coenzyme B12-dependent mutases.Chem Rev. 2003 Jun;103(6):2083-94. doi: 10.1021/cr0204395. Chem Rev. 2003. PMID: 12797824 Review. No abstract available.
Cited by
-
Combined spectroscopic/computational studies of vitamin B12 precursors: geometric and electronic structures of cobinamides.Inorg Chem. 2012 Mar 5;51(5):2867-79. doi: 10.1021/ic202052g. Epub 2012 Feb 14. Inorg Chem. 2012. PMID: 22332807 Free PMC article.
References
-
- Dolphin D, editor. B12. New York: Wiley-Interscience; 1982.
-
- Marzilli LG. In: Bioinorganic Catalysis. Reedijk J, editor. New York: Marcel Dekker; 1993. pp. 227–259.
-
- Kräutler B, Arigoni D, Golding BT, editors. Vitamin B12 and B12 Proteins. New York: Wiley-VCH; 1998.
-
- Banerjee R. Chemistry and Biochemistry of B12. New York: John Wiley and Sons; 1999.
-
- Banerjee R. Chem.Biol. 1997;4:175–186. - PubMed
MeSH terms
Substances
Grants and funding
LinkOut - more resources
Full Text Sources

