. 2006 Jun 30:7:53.
doi: 10.1186/1471-2202-7-53.

Dopamine presynaptically and heterogeneously modulates nucleus accumbens medium-spiny neuron GABA synapses in vitro

Affiliations

Dopamine presynaptically and heterogeneously modulates nucleus accumbens medium-spiny neuron GABA synapses in vitro

Daron Geldwert et al. BMC Neurosci. .

Abstract

Background: The striatal complex is the major target of dopamine action in the CNS. There, medium-spiny GABAergic neurons, which constitute about 95% of the neurons in the area, form a mutually inhibitory synaptic network that is modulated by dopamine. When put in culture, the neurons reestablish this network. In particular, they make autaptic connections that provide access to single, identified medium-spiny to medium-spiny neuron synaptic connections.

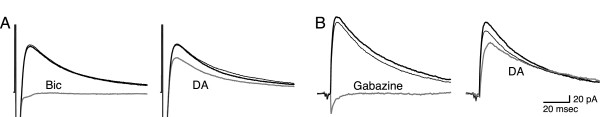
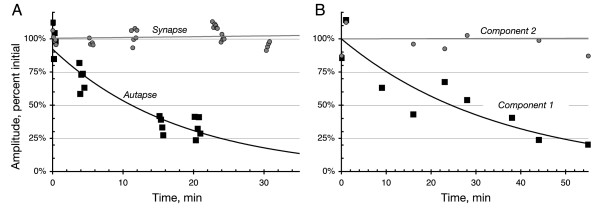
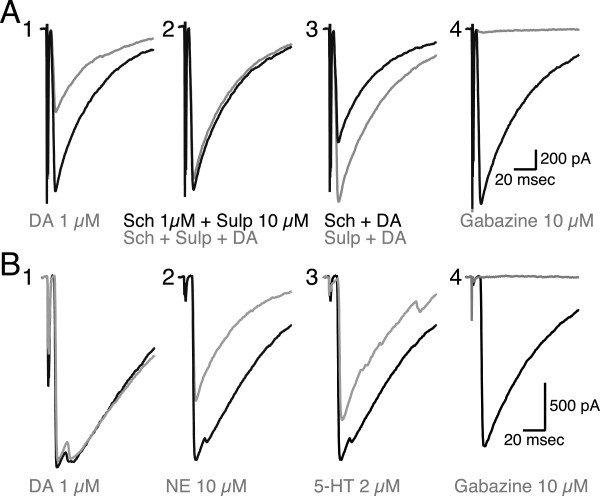
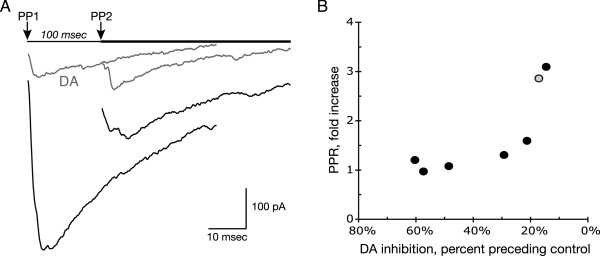
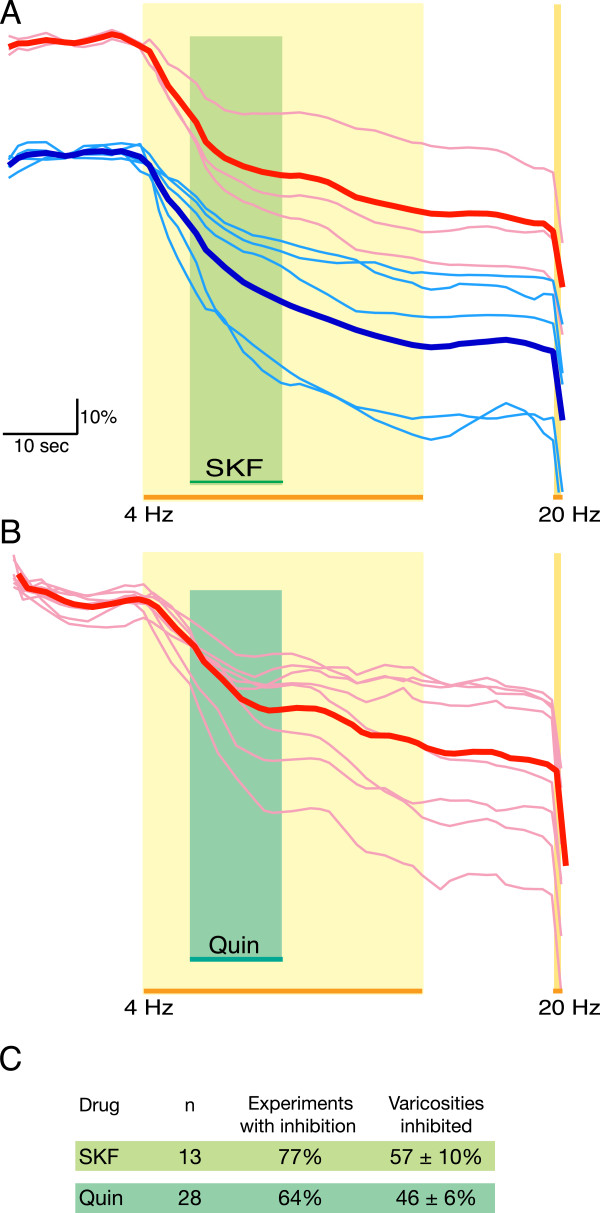
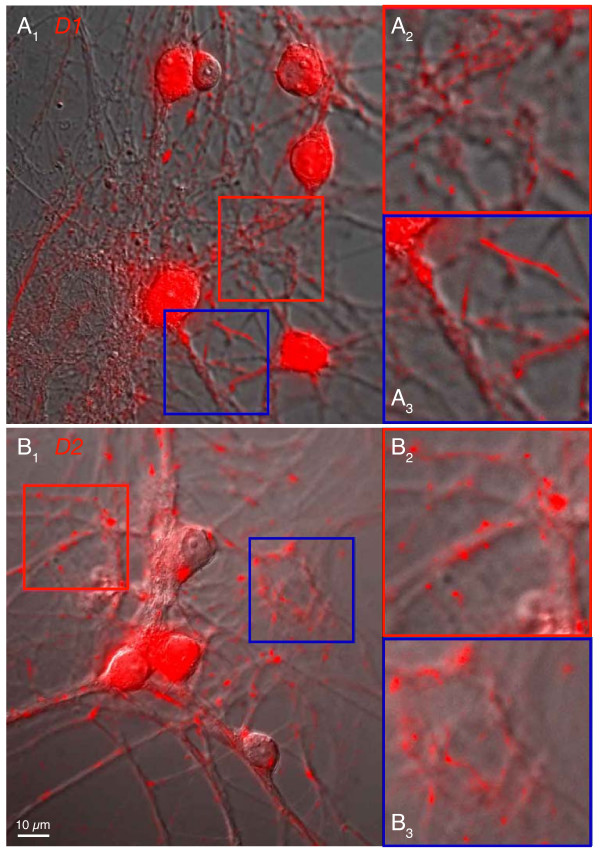
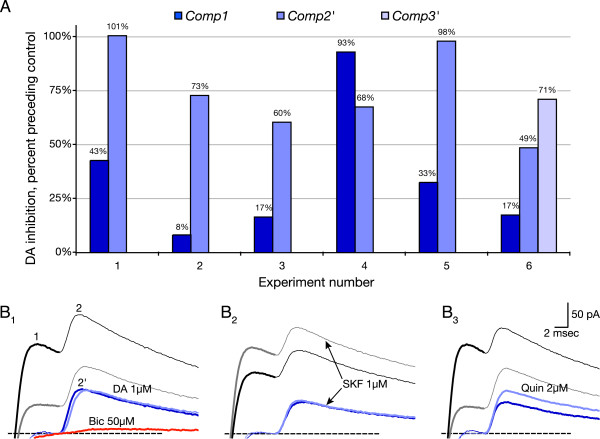
Results: We examined medium-spiny neuron autaptic connections in postnatal cultures from the nucleus accumbens, the ventral part of the striatal complex. These connections were subject to presynaptic dopamine modulation. D1-like receptors mediated either inhibition or facilitation, while D2-like receptors predominantly mediated inhibition. Many connections showed both D1 and D2 modulation, consistent with a significant functional colocalization of D1 and D2-like receptors at presynaptic sites. These same connections were subject to GABAA, GABAB, norepinephrine and serotonin modulation, revealing a multiplicity of modulatory autoreceptors and heteroreceptors on individual varicosities. In some instances, autaptic connections had two components that were differentially modulated by dopamine agonists, suggesting that dopamine receptors could be distributed heterogeneously on the presynaptic varicosities making up a single synaptic (i.e. autaptic) connection.

Conclusion: Differential trafficking of dopamine receptors to different presynaptic varicosities could explain the many controversial studies reporting widely varying degrees of dopamine receptor colocalization in medium-spiny neurons, as well as more generally the diversity of dopamine actions in target areas. Longer-term changes in the modulatory actions of dopamine in the striatal complex could be due to plasticity in the presynaptic distribution of dopamine receptors on medium-spiny neuron varicosities.


Figures

Figure 1
Figure 1
Medium-spiny neuron autaptic and synaptic responses. A. Autaptic response inhibited by bicuculline. Using a standard K-gluconate-based intracellular solution, an autaptic response (left, thick black trace) was evoked by a 1 msec depolarizing command, which triggered an inward action current (truncated off bottom of record, at start of trace). Local perfusion with the GABAA antagonist bicuculline (gray trace; Bic, 50 μM) completely blocked the response (leaving a small inward tail of the action current). The autaptic response recovered fully (thin black trace), nearly superimposing on the initial, control trace. Perfusion with dopamine (DA, 1 μM) inhibited the autaptic response (right), and this recovered fully. The wash trace in the left panel is the same as control trace in the right panel. Cells were stimulated throughout the experiment at 0.1 Hz to avoid frequency-dependent effects. Control, drug-treatment, and wash traces were collected after responses had stabilized, typically 30 sec after drug application or wash. Averages of 10 traces are shown. The amplitude of the initial control response was 140 pA, which was representative of the amplitude of the autaptic responses measured. B.Synaptic current response inhibited by gabazine. In another experiment, a nearby neuron was stimulated with a loose-patch electrode, evoking a synaptic response in the recorded MSN (left, thick black trace). Local perfusion with the GABAA antagonist gabazine (10 μM) completely (gray trace) blocked the response (leaving the small inward tail from the stimulus artifact). Following the wash (thin black trace), the synaptic response nearly recovered. Perfusion with DA (1 μM) inhibited the response (right), and this recovered with a second wash, although not completely. Traces shown are averages of 4 or 5 responses. Synaptic responses showed greater variation in amplitude than autaptic responses. The amplitude of the initial control synaptic response shown here was 220 pA, which was somewhat smaller than the typical synaptic response.
Figure 2
Figure 2
Differential run down of autaptic vs. synaptic responses. A. Control responses are presented from two experiments done on sister cultures recorded a day apart. While the synaptic response was stable for the duration of the experiment, the autaptic response showed significant run-down. B. In some recordings (see Figure 7) there was a second autaptic response (Component 2) riding on top of the initial response (Component 1), Component 1 ran down, while Component 2 did not, suggesting that Component 2 was mediated by autaptic connections made on more distal dendrites.
Figure 3
Figure 3
Neurotransmitter modulation of autaptic response. A. Here, a high-chloride intracellular solution was used so that autaptic responses were inward and larger. (A1) DA (gray trace) inhibited the autaptic response, here to 52% of control. (A2) Application of the D1 antagonist SCH23390 (SCH) together with Sulpiride (Sulp) had no impact on the response (black trace), but blocked DA action (gray trace). (A3) In this experiment, the DA inhibition was D2-mediated, as Sulpiride blocked DA action completely (gray trace), while SCH23390 had only a modest effect. (A4) At the end of the experiment, gabazine (gray trace) completely blocked the autaptic response. B. In another cell, (B1) the autaptic connection did not show DA modulation. However, (B2) Norepinephrine (NE; 68% inhibition) and (B3) Serotonin (5-HT; 78% inhibition) inhibited the autaptic response, arguing that DA does not act through other monoamine receptors. (B4) At the end of the experiment, the autaptic response was completely blocked by Gabazine.
Figure 4
Figure 4
Paired-pulse facilitation. A. Paired pulses (PP1 and PP2) were delivered at a 100 msec interval in the absence (saline, black traces) and the presence of DA, 1 μM (gray traces). In this experiment, DA produced a dramatic inhibition to 17% of control, which was accompanied by about a 3-fold increase in the paired-pulse ratio (PPR), from 0.47 to 1.34. Traces shown are the averages of 5 traces. B. Plotting PPR vs. DA inhibition (expressed as the percent of the preceding control IPSC) for all paired-pulse experiments (n = 8), showed that PPR increased with DA modulation, indicative of presynaptic action. The gray-filled circle, corresponds to the experiment shown in panel A.
Figure 5
Figure 5
Imaging presynaptic modulation by FM1-43 destaining. Synaptic vesicles were loaded (stained) with FM1-43 by field stimulation, and then imaged every 1.25 sec. After a control period (15 images), showing that there was limited bleaching, field stimulation was applied at 4 Hz; destaining was monitored at 8varicosities (thin traces). A. During this stimulation, the D1 agonist SKF38393 (SKF,10 μM) was perfused (10 images). For 5 varicosities (blue traces), there was no inflection in the destaining curve, while in the others (red traces), the destaining was arrested, creating an inflection. The two thick traces are averages of the sets of effect and no-effect traces. The effect traces were offset upwards for the sake of the illustration. Once the SKF38393 was washed off, and the stimulation continued, destaining continued or resumed. After an interval of no stimulation, the remaining FM1-43 was unloaded with a 20 Hz tetanus. A total of 70 images were acquired. B. In another culture, the D2 agonist Quinpirole (Quin, 1 μM) was applied. In this experiment all 8 varicosities showed inhibition (red traces). D2 effects typically had a greater latency; note that the plateau started roughly when the drug was washed off (presumably coincidental). C. Overall, the majority of experiments showed either D1 or D2 inhibition, and in those experiments about half of varicosities showed inhibition (expressed as mean ± s.e.m.). Facilitation, as would be reflected in an increase in the destaining rate, was not seen. In each of the 13 D1 agonist experiments, a minimum of 2 varicosities showed inhibition; in the 18 D2 agonist experiments, 3 experiments had only one varicosity that showed inhibition. In one D1 agonist experiment and in one D2 agonist experiment every varicosity showed inhibition.
Figure 6
Figure 6
DA receptor immunostaining shows a presynaptic pattern. A. D1 immunostaining. (A1) A field in a nAcc culture is shown with fluorescence superimposed on a differential interference contrast (DIC) image. Here five of six cells were D1 immunoreactive. Note that the cell body staining did not extend reliably out onto the dendrites. Rather, punctate or linear staining was seen in the neuropil, consistent with staining of axons and presynaptic varicosities. Regions of interest outlined in red and blue are shown at 2× magnification on the right side. (A2) D1 fluorescence revealed strings of varicosities studding a thin process. (A3) In another region of the neuropil, continuous staining of putative-axonal processes was seen. B. D2 immunostaining. (B1) A field in a different nAcc culture containing four neurons, two of which were D2 immunoreactive, is shown. Again, note that the cell body staining does not extend continuously out onto the dendritic processes. Rather, punctate and linear staining of putative axonal processes is evident in the neuropil. (B2) Several varicosities without clear intervening axonal staining are seen studding unstained dendrites. A stretch of labeled axon is seen on the lower, right corner of the field. (B3) In another region, there were stained varicosities studding axonal processes. Note the dearth of postsynaptic dendritic labeling.
Figure 7
Figure 7
Dopamine modulation of multicomponent responses. A. In each of six experiments with multiple components, DA inhibited the components differentially. In experiment number 6, there were three components and each was differentially modulated. Component 1 (Comp1) was measured directly; components 2' and 3' were measured from the calculated responses after exponential extrapolation of the preceding component (or in experiment 6, the preceding two components). B. Differential DA modulation is illustrated in traces from experiment 5, in which we were successful in testing the effects of both D1 and D2 agonists. (B1) The control response had two components (1 and 2). Comp1 was extended by exponential curve fitting and then subtracted from the control trace to isolate Comp2' (blue traces). The sections of the traces measured (for Comp1 and Comp2') are shown thickened. DA (gray thick trace) inhibited Comp1 to 33% of control, while it had no effect on 2' (light blue thick trace). Bicuculline (Bic) blocked both components, nearly completely. (B2) SKF38393 (SKF) facilitated Comp1 (gray thick trace), but had no effect on Comp2' (light blue thick trace). (B3) Quinpirole (Quin), inhibited Comp1 (gray thick trace) and facilitated Comp2' (light blue thick trace). The dashed line indicates the zero current baseline.

References

    1. Pickel VM, Nirenberg MJ, Milner TA. Ultrastructural view of central catecholaminergic transmission: immunocytochemical localization of synthesizing enzymes, transporters and receptors. Journal of Neurocytology. 1996;25:843–856. doi: 10.1007/BF02284846. - DOI - PubMed
    1. Smith AD, Bolam JP. The neural network of the basal ganglia as revealed by the study of synaptic connections of identified neurones. Trends in Neurosciences. 1990;13:259–265. doi: 10.1016/0166-2236(90)90106-K. - DOI - PubMed
    1. Pennartz CM, Groenewegen HJ, Lopes da Silva FH. The nucleus accumbens as a complex of functionally distinct neuronal ensembles: an integration of behavioural, electrophysiological and anatomical data. Progress in Neurobiology. 1994;42:719–761. doi: 10.1016/0301-0082(94)90025-6. - DOI - PubMed
    1. Koos T, Tepper JM. Inhibitory control of neostriatal projection neurons by GABAergic interneurons. Nature Neuroscience. 1999;2:467–472. doi: 10.1038/8138. - DOI - PubMed
    1. Wilson CJ. Basal ganglia. In: Shepherd GM, editor. The Synaptic Organization of the Brain. Fifth. New York , Oxford University Press; 2004. pp. 361–413.

Publication types

MeSH terms

LinkOut - more resources