. 2006 Sep 15;91(6):2097-114.
doi: 10.1529/biophysj.106.088203. Epub 2006 Jun 30.

Structure-based model of the stepping motor of PcrA helicase

Affiliations

Structure-based model of the stepping motor of PcrA helicase

Jin Yu et al. Biophys J. .

Abstract

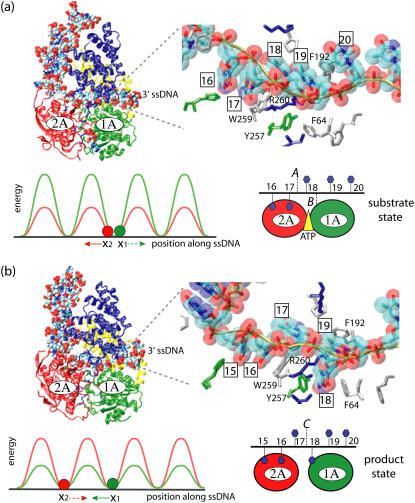
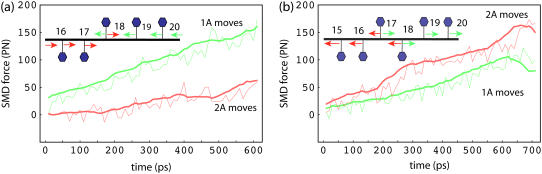
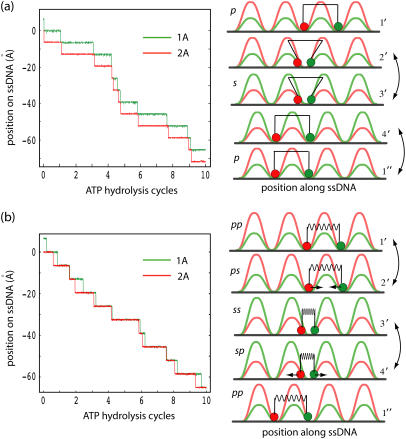
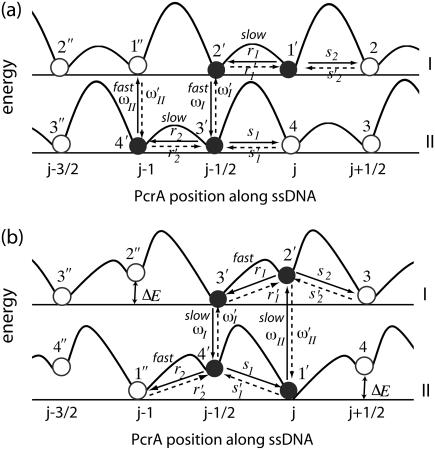
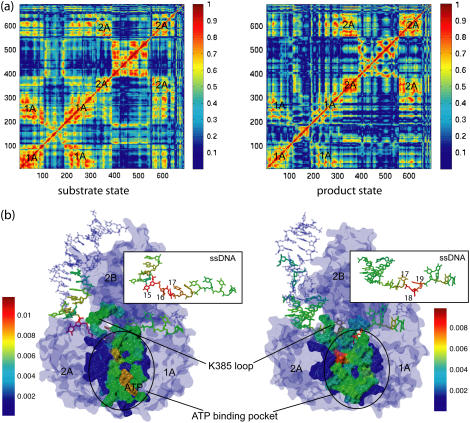
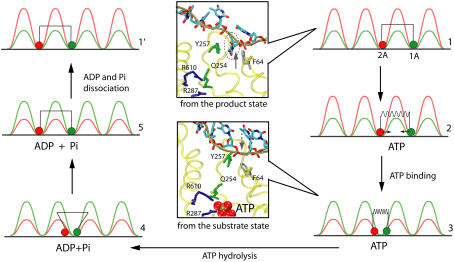
DNA helicases are ubiquitous molecular motors involved in cellular DNA metabolism. They move along single-stranded DNA (ssDNA) and separate duplex DNA into its component strands, utilizing the free energy from ATP hydrolysis. The PcrA helicase from Bacillus stearothermophilus translocates as a monomer progressively from the 3' end to the 5' end of ssDNA and is one of the smallest motor proteins structurally known in full atomic detail. Using high-resolution crystal structures of the PcrA-DNA complex, we performed nanosecond molecular dynamics simulations and derived potential energy profiles governing individual domain movement of the PcrA helicase along ssDNA. Based on these profiles, the millisecond translocation of the helicase along ssDNA was described through Langevin dynamics. The calculations support a domain stepping mechanism of PcrA helicase, in which, during one ATP hydrolysis cycle, the pulling together and pushing apart of domains 2A and 1A are synchronized with alternating mobilities of the individual domains in such a fashion that PcrA moves unidirectionally along ssDNA. By combining short timescale (nanoseconds) molecular dynamics and long timescale (milliseconds) stochastic-dynamics descriptions, our study suggests a structure-based mechanism of the ATP-powered unidirectional movement of PcrA helicase.


Figures

FIGURE 1
FIGURE 1
Schematic view of a PcrA helicase-DNA complex with ATP bound (a) and without ATP/ADP bound (b). (Top, left) Shown are the protein domains (in cartoon presentation: red, 2A domain; green, 1A domain; blue, 2B domain; yellow, 1B domain) along with DNA (van der Waals presentation: red, oxygen; cyan, carbon; blue, nitrogen; tan, phosphorus; white, hydrogen); the duplex DNA is bound to the top left of PcrA and is flanked by a 3′ ssDNA that crosses through the middle of PcrA from left to right. (Top, right) Shown is an enlarged view of the ssDNA crossing through PcrA together with key amino acids. The DNA is shown in both licorice and (transparent) van der Waals (hydrogens not shown for clarity) presentation; amino acids (in licorice presentation) are color-coded (green, polar; white, nonpolar; blue, positively charged; red, negatively charged). Note that the DNA strand is negatively charged. (Bottom, right) The top figures are summarized into a schematic view highlighting the key elements, including the numbering of the ssDNA units (nucleotides) directly involved in binding. (bottom, left) The individual potentials of the two PcrA domains moving along ssDNA are introduced; the red and green disks correspond to the position of the domains 2A and 1A, respectively; the corresponding potential energy profiles are given in red and green; one can recognize that in the (substrate) state (a) with ATP bound, domain 2A is supposed to experience lower energy barriers than domain 1A, while in the (product) state (b) after ADP and phosphate dissociate, domain 1A is supposed to experience lower energy barriers than domain 2A. We use in this figure and other figures the one-letter code for amino acids.
FIGURE 2
FIGURE 2
Site energies of ssDNA units (nucleotides) and individual domain potentials for PcrA with ATP bound (a) and without ATP bound (b). Solid diamonds represent the relative binding free energies of ssDNA units, i.e., the weighted sum of electrostatic and vdW energies between protein and individual nucleotides, with the separate contributions indicated through open triangles and open pentagons, respectively. A smooth site energy function Eb(x) is drawn through the solid diamonds using a third-order polynomial interpolation (with the parameter δ = 0; see Supplementary Material). The corresponding positions of nucleotides are shown along x, the ssDNA path; i for each position xi labels the nucleotide. The inset shows the potential Uiσx) experienced by domain 2A (red solid curve) and 1A (green solid curve) as the domains move along ssDNA; the length scale is in units of 1-nt distance (6.5 Å). Uiσx), defined in the text, is derived from the site energy Eb(x) in the figure; the dashed line represents the difference between the green and the red curve.
FIGURE 3
FIGURE 3
Equilibrium MD simulations of the PcrA-DNA complex. The simulation system is shown on the left, with the PcrA-DNA complex (protein in dark blue, DNA in magenta) solvated in an explicit water box (light blue), together with ions (sodium in yellow, magnesium in green, and chloride in light blue); ATP, colored in red, is present in the system. Shown on the right are the root mean-square deviation value of protein and DNA backbone atoms with (top) and without (bottom) ATP bound.
FIGURE 4
FIGURE 4
Comparisons of SMD forces arising in ssDNA pulling simulations in PcrA with ATP bound (a) and without ATP bound (b). The green/red curve represents the average force needed to move relevant nucleotides (indicated by green/red arrows), corresponding to the movement of domain 1A/2A in the opposite direction. The thin curves were measured directly from simulations, while the thick curves were smoothed over every 10 data points. The results show that in panel a, the average force needed to shift the relevant nucleotides, corresponding to the domain movement of 2A, is smaller than the average force needed to shift the relevant nucleotides corresponding to the domain movement of 1A; the opposite is true in panel b.
FIGURE 5
FIGURE 5
Langevin simulation of ssDNA translocation in PcrA in the weak coupling scenario (a) and in the strong coupling scenario (b). (Left) Shown are trajectories of the two domains, 1A (green) and 2A (red), moving along ssDNA; the time is given in units of ATP hydrolysis cycles (one cycle is ∼20 ms). (Right) Illustrated are the individual potentials Uiσ experienced by domain 1A (green) and domain 2A (red) moving along ssDNA in different states (p, s or pp, ps, ss, and sp defined in Methods), or configurations (1′, 2′, 3′, and 4′, which are defined for the convenience of later discussions; see Fig. 6). Transitions which do not involve domain movements (and are simulated by a Poisson process; see Methods) are labeled by double arrows in both scenarios. In the weak coupling scenario, two domains are shown as being connected by a rod, corresponding to the geometric constraint; in the strong coupling scenario (b), the domains are shown as being connected by an elastic spring with variable equilibrium lengths, corresponding to the nonvanishing interaction Vσ′.
FIGURE 6
FIGURE 6
Schematic energetics of PcrA translocating along ssDNA in the weak coupling scenario (a) and in the strong coupling scenario (b). Shown schematically are total energy profiles (in both I and II) projected along the position of PcrA (average position of domain 2A and 1A) on ssDNA in units of l0, i.e., one-nt distance (∼6.5 Å). Configurations 1′, 2′, 3′, 4′, and 1″ (see Fig. 5), etc., and transitions connecting these configurations as well as the associated rate constants are labeled (see text for detail). Fast and slow steps in each scenario are also denoted.
FIGURE 7
FIGURE 7
Contribution from individual amino-acid residues to the barrier difference |A2σA1σ| of domain motions of PcrA with ATP bound (a) and without ATP bound (b). (left) Shown is a detailed view of ssDNA units (nucleotides, in licorice presentation) and relevant amino acids in its vicinity (in both licorice and transparent vdW presentations). The important amino acids, which energetically contribute most, are labeled. The same color code is used as in Fig. 1. Note that Arg-260 and Lys-385 contribute most prominently to the barrier difference A1sA2s in panel a and A2pA1p in panel b, respectively; Lys-385 is located in a loop region, shown in transparent tube presentation, colored yellow. The black dashed curve circles around the ATP binding pocket. (Right) Shown are the contributions from individual amino acids to the barrier difference A1sA2s in panel a and A2pA1p in panel b, separating electrostatic (top) and vdW (bottom) contributions.
FIGURE 8
FIGURE 8
Correlation analysis based on MD simulations (a) and a so-called dynamical coupling analysis based on an elastic network model (61) (b). The correlation maps in panel a are colored according to the amplitude of the cross correlation matrix element C(i, j) defined in the text. The matrices were calculated from 3-ns MD simulations for both the s and p states. In the s state, the average amplitude of cross correlation is ∼0.71 inside domain 1A and ∼0.68 inside domain 2A; in the p state, the average amplitude of cross correlation is ∼0.58 inside domain 1A and ∼0.63 inside domain 2A. The PcrA-DNA complexes in panel b are colored according to the dynamical coupling of residues to the fluctuations of the ATP binding pocket in both the s and p states. The dynamic coupling is probed (see (61)) through perturbation of a residue's spring constant and monitoring the ensuing effect on the vibrational fluctuation 〈δr2〉 of the ATP binding site. The protein, DNA, and ATP are shown in surface, licorice, and vdW presentations, respectively.
FIGURE 9
FIGURE 9
Five-step PcrA translocation cycle. The figure shows schematically a translocation cycle for a mixed scenario (weak coupling as well as strong coupling; see text) involving configurations 1–5 as well as configuration 1′, which is equivalent to configuration 1, except moved forward by one nt. The mixed scenario involves both a loaded spring (nonzero potential Vσ′(x1, x2), transition 2→3) and a step with a random thermal motion (vanishing potential Vσ′(x1, x2), transition 4→5). In configurations 1, 2, and 1′, domain 1A (green) moves more readily than domain 2A (red), while it is the opposite for configurations 3–5. The inset figures show how the domain and ssDNA base motions are coupled to the chemistry at the ATP binding site: upon the approach of domains 2A and 1A, Arg-287, and Arg-610 move close to the γ-phosphate of ATP; Gln-254 is linked closely to Tyr-257, which forms a key binding pocket for an ssDNA base, but squeezes out the base when the domains approach each other in binding ATP; Gln-254 has been identified as a key participant in ATP hydrolysis along with the mentioned arginines (17). The suggested mechanism therefore involves three steps: 1), binding of ATP that pulls domain 1A toward domain 2A; 2), insertion of Arg-287 and Arg-610 into an optimal (for hydrolysis) position in the ATP binding pocket along with Gln-254 linked to a key ssDNA interaction site; and 3), rapid hydrolysis of ATP that initiates separation of domains 2A and 1A through movement of 2A alone.

Similar articles

Cited by

References

    1. Lohman, T., and K. Bjornson. 1996. Mechanisms of helicase-catalyzed DNA unwinding. Annu. Rev. Biochem. 65:169–214. - PubMed
    1. Bird, L., S. Subramanya, and D. Wigley. 1998. Helicases: a unifying structural theme. Curr. Opin. Struct. Biol. 8:14–18. - PubMed
    1. Waksman, G., E. Lanka, and J. Carazo. 2000. Helicases as nucleic acid unwinding machines. Nat. Struct. Biol. 7:20–22. - PubMed
    1. Marians, K. 2001. Crawling and wiggling on DNA: structural insights to the mechanism of DNA unwinding by helicases. Structure. 8:R227–R235. - PubMed
    1. Caruthers, J., and D. McKay. 2002. Helicase structure and mechanism. Curr. Opin. Struct. Biol. 12:123–133. - PubMed

Publication types

LinkOut - more resources