. 2006 Sep 15;91(6):2082-96.
doi: 10.1529/biophysj.106.087296. Epub 2006 Jun 30.

Glucose modulates [Ca2+]i oscillations in pancreatic islets via ionic and glycolytic mechanisms

Affiliations

Glucose modulates [Ca2+]i oscillations in pancreatic islets via ionic and glycolytic mechanisms

Craig S Nunemaker et al. Biophys J. .

Abstract

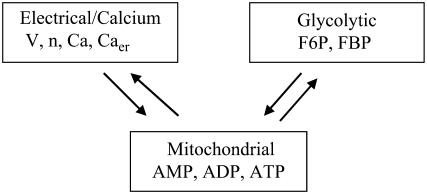
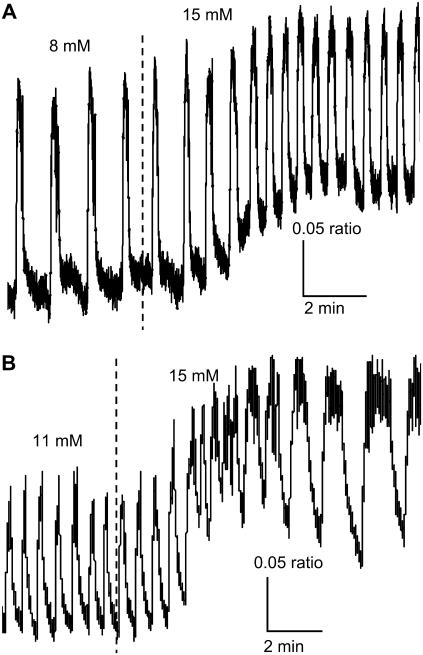
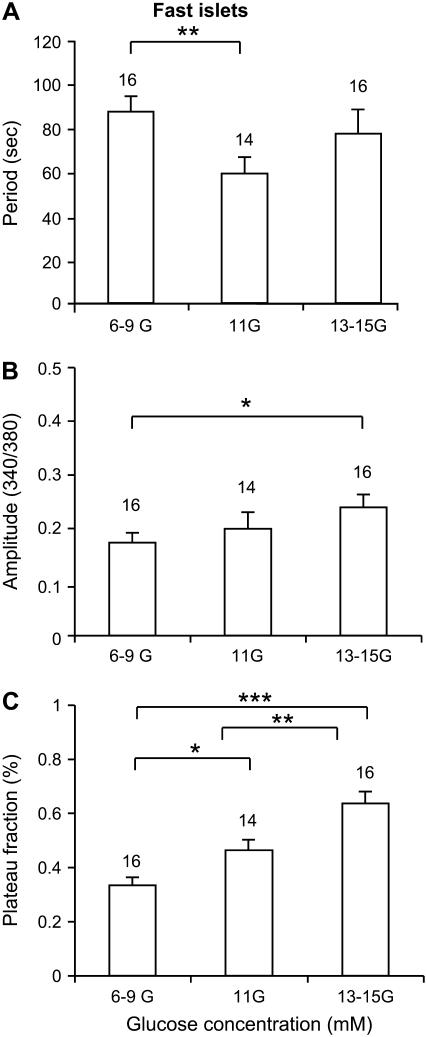
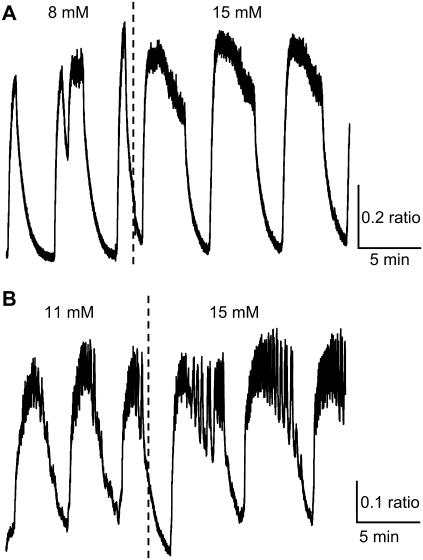
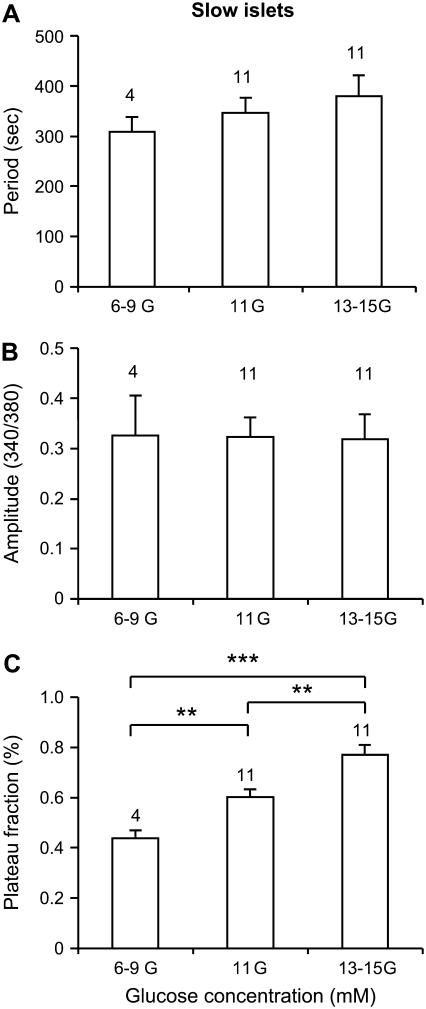
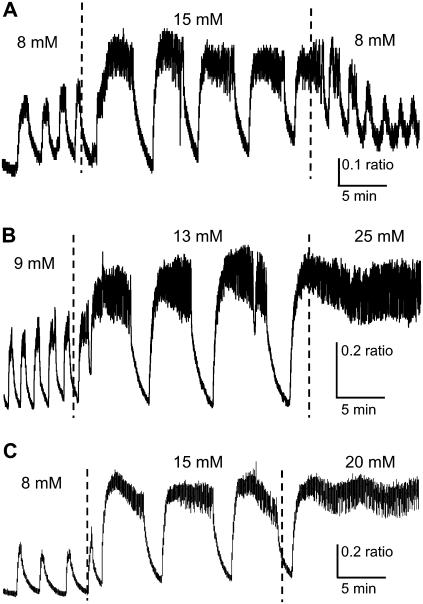
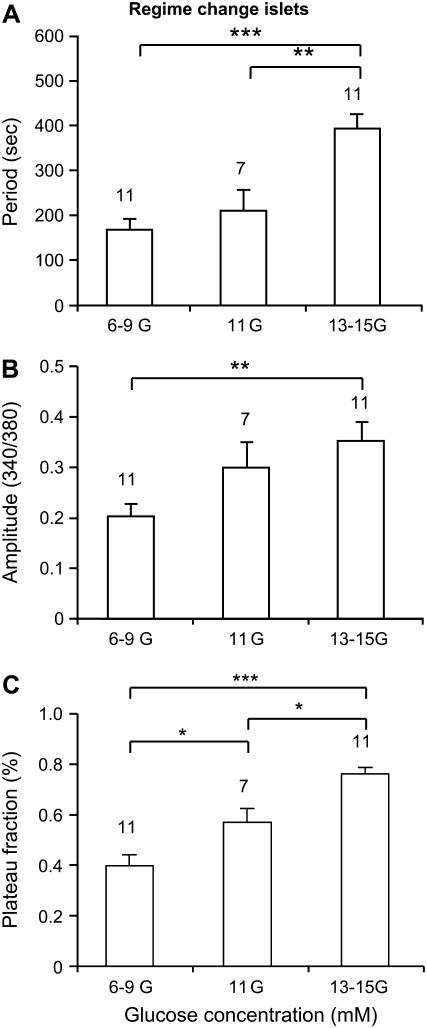
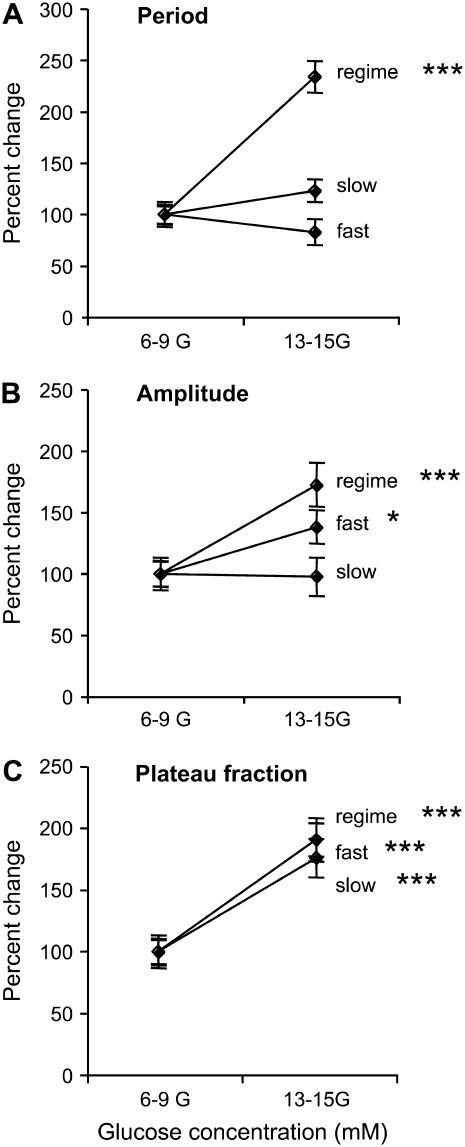
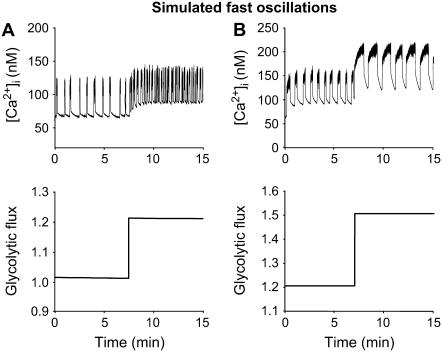
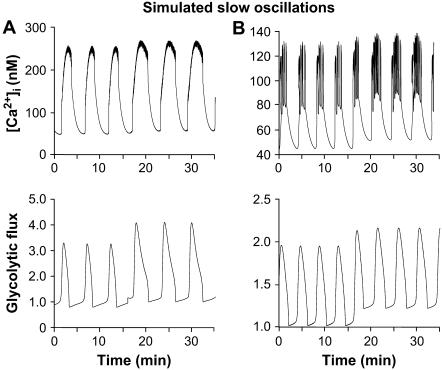
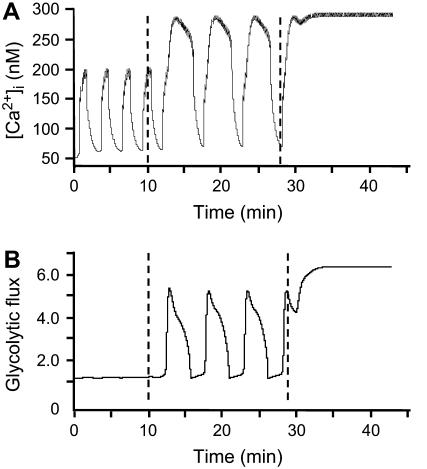
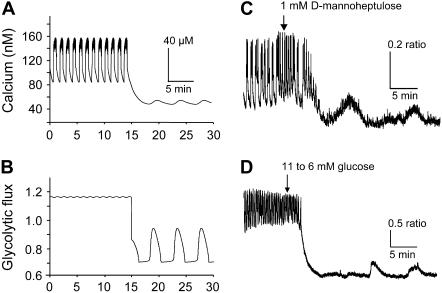
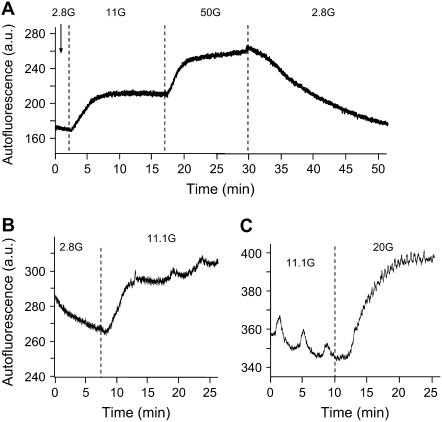
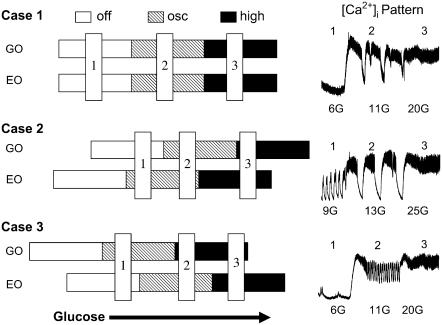
Pancreatic islets of Langerhans display complex intracellular calcium changes in response to glucose that include fast (seconds), slow ( approximately 5 min), and mixed fast/slow oscillations; the slow and mixed oscillations are likely responsible for the pulses of plasma insulin observed in vivo. To better understand the mechanisms underlying these diverse patterns, we systematically analyzed the effects of glucose on period, amplitude, and plateau fraction (the fraction of time spent in the active phase) of the various regimes of calcium oscillations. We found that in both fast and slow islets, increasing glucose had limited effects on amplitude and period, but increased plateau fraction. In some islets, however, glucose caused a major shift in the amplitude and period of oscillations, which we attribute to a conversion between ionic and glycolytic modes (i.e., regime change). Raising glucose increased the plateau fraction equally in fast, slow, and regime-changing islets. A mathematical model of the pancreatic islet consisting of an ionic subsystem interacting with a slower metabolic oscillatory subsystem can account for these complex islet calcium oscillations by modifying the relative contributions of oscillatory metabolism and oscillatory ionic mechanisms to electrical activity, with coupling occurring via K(ATP) channels.


Figures

FIGURE 1
FIGURE 1
Illustration of the three model components. Arrows indicate interactions between components.
FIGURE 2
FIGURE 2
Two examples of the response to glucose of fast islet [Ca2+]i oscillations. (A) [Ca2+]i bursts decrease in period and increase in plateau fraction as glucose is raised from 8 to 15 mM glucose due to a reduction in the time spent in the silent phase of each burst. (B) [Ca2+]i bursts increase in period and plateau fraction as glucose is increased from 11 to 15 mM glucose due to an increase in the time spent in the active phase.
FIGURE 3
FIGURE 3
Summary of the effects of glucose on fast bursting islets in terms of period (A), amplitude (B), and plateau fraction (C). *Indicates p < 0.05, **p < 0.01, ***p < 0.001.
FIGURE 4
FIGURE 4
Two examples of the response to glucose of slow islet [Ca2+]i oscillations. (A,B) [Ca2+]i oscillations increase in plateau fraction as glucose is increased due to the greater time spent in the active phase and a reduction in time spent in the silent phase. In each case, the period of oscillations was only slightly increased. In panel B, fast bursts are superimposed on the slow oscillations (compound oscillations).
FIGURE 5
FIGURE 5
Summary of the effects of glucose on slow islet oscillations in terms of period (A), amplitude (B), and plateau fraction (C). *Indicates p < 0.05, **p < 0.01, ***p < 0.001.
FIGURE 6
FIGURE 6
Examples of regime change in islet [Ca2+]i patterns. (A) Fast [Ca2+]i bursts reversibly change to slow oscillations of greater period, amplitude, and plateau fraction as glucose is increased and then decreased. (B) Fast [Ca2+]i bursts progressively change to slow oscillations and eventually a sustained plateau as glucose is increased from 9 to 13 to 25 mM glucose. (C) Slow subthreshold oscillations change progressively to fast bursting, and eventually a sustained plateau as glucose is increased from 8 to 15 to 20 mM glucose. Note that the plateau is oscillatory, suggesting modulated continuous spike activity.
FIGURE 7
FIGURE 7
Summary of the effects of glucose on regime-changing islets in terms of period (A), amplitude (B), and plateau fraction (C). *Indicates p < 0.05, **p < 0.01, ***p < 0.001. Note that this figure excludes data from the small fraction of islets that responded to increased glucose with regime change from slow to fast patterns (see example in Fig. 14), since these changes are opposite to the trends represented here. The changes described in this figure remain statistically significant even with the inclusion of these contrary islets.
FIGURE 8
FIGURE 8
Summary of the fractional changes in period (A), amplitude (B), and plateau fraction (C) from low to high glucose concentrations. Fast (n = 16), slow (n = 11), and regime change (n = 11) are plotted together to illustrate the differences and similarities.
FIGURE 9
FIGURE 9
Simulation of the glucose response of fast activity; compare to Fig. 2. Fast bursting is driven by purely electrical mechanisms; the input from glycolysis, r + γ, is constant at any glucose level. (A) Fast [Ca2+]i oscillations become faster while glycolytic flux increases in a steady-state manner. This is achieved by increasing the flux through glucokinase JGK from 0.02 s−1 to 0.03 s−1 and increasing r from 1.0 to 1.4. Shortening of the silent phase leads to a decrease in the period from 95 to 64 s (gKca = 450, gCa = 1000, gKATP = 25,000, kγ = 10, JGK = 0.02, and vγ = 2.2). (B) The period of these fast oscillations is increased from 78 s to 94 s due to lengthening of the active phase, which is achieved by increasing the flux through glucokinase from 0.02 s−1 to 0.025 s−1 and r from 1.2 to 1.5 (gKCa = 300, gCa = 1000, gKATP = 26,000, kγ = 10, JGK = 0.02, and vγ = 2.2).
FIGURE 10
FIGURE 10
Simulation of the glucose response of slow activity; compare to Fig. 4. (A) Pure slow [Ca2+]i oscillations (top panel) driven by glycolytic oscillations (bottom panel). Increase in JGK (0.10 s−1–0.15 s−1) and increase in r (0.7–0.9) caused an increase in the active phase duration. The period increased from 6.3 min to 6.5 min; and the plateau fraction increased from 0.28 to 0.38 (gKCa = 25, gCa = 1000, gKATP = 27,000, kγ = 5, and vγ = 10). (B) Compound oscillations. An increase in r (1.0–1.2) caused an increase in the active phase duration, which resulted in an increase in period from 4.1 min to 4.5 min and an increase in the plateau fraction from 0.36 to 0.46. Consistent with what is seen experimentally (Fig. 4), no change in amplitude was seen and only a modest increase in period (gKCa = 900, gCa = 900, gKATP = 26,000, kγ =10, JGK = 0.2, and vγ = 10).
FIGURE 11
FIGURE 11
Simulation of regime change; compare to Fig. 6. Simulated [Ca2+]i oscillations (A) with corresponding glycolytic flux (B). The input from glycolysis is constant. For the simulations of low (8 mM), intermediate (15 mM), and high (20 mM) glucose, JGK was increased from 0.02 s−1 to 0.2 s−1 to 0.6 s−1. At the lowest JGK level, the mechanism underlying [Ca2+]i oscillations is purely electrical, whereas at the intermediate level, the oscillations are driven by the combined influence of glycolytic and [Ca2+]i-dependent ionic mechanisms. At the highest value, oscillations cease, leaving only fast spiking, because the system is saturated (gKCa = 25, gCa = 1000, gKATP = 27,000, kγ = 10, vγ = 50, and r = 1.0).
FIGURE 12
FIGURE 12
Prediction of subthreshold [Ca2+]i oscillations by reducing glucokinase activity. (A,B) A purely fast [Ca2+]i pattern (A) is predicted by the model at a very high rate of glucokinase activity (JGK = 0.4 s−1) and a moderate rate for the constant component of glycolysis (r = 1.0 s−1). Modestly lowering both rates (JGK = 0.2 s−1, r = 0.7) converts the fast pattern to a slow subthreshold oscillation in which glycolysis begins to oscillate (B) but is able to induce only a small ripple in [Ca2+]i (A). (gKCa = 300, gCa = 1000, gKATP = 25,000, kγ = 10, and vγ = 2.2.) The predicted conversion of [Ca2+]i patterns is demonstrated experimentally by treating islets with a low dose of the glucokinase inhibitor mannoheptulose (C) or by reducing glucose from 11 mM to 6 mM (D).
FIGURE 13
FIGURE 13
NAD(P)H autofluorescence measurements in islets. (A) An example of changes in NAD(P)H in response to different glucose concentrations, with each glucose change denoted by vertical dotted lines. (B) An example of oscillations in NAD(P)H emerging as glucose is increased from 2.8 to 11 mM glucose. (C) An example of slow oscillations in NAD(P)H disappearing when glucose increases from 11 to 20 mM glucose.
FIGURE 14
FIGURE 14
A schematic representation of the different relationships between the mechanisms that drive fast electrical oscillations (EO) and slow glycolytic oscillations (GO), and the [Ca2+]i patterns that result from the various interactions. See text for details.

Similar articles

Cited by

References

    1. Hellerstrom, C. 1967. Effects of carbohydrates on the oxygen consumption of isolated pancreatic islets of mice. Endocrinology. 81:105–112. - PubMed
    1. Hutton, J. C., and W. J. Malaisse. 1980. Dynamics of O2 consumption in rat pancreatic islets. Diabetologia. 18:395–405. - PubMed
    1. Duchen, M. R. 1999. Contributions of mitochondria to animal physiology: from homeostatic sensor to calcium signalling and cell death. J. Physiol. 516:1–17. - PMC - PubMed
    1. Ashcroft, F. M., and P. Rorsman. 1989. Electrophysiology of the pancreatic β-cell. Prog. Biophys. Mol. Biol. 54:87–143. - PubMed
    1. Bratusch-Marrain, P. R., M. Komjati, and W. K. Waldhausl. 1986. Efficacy of pulsatile versus continuous insulin administration on hepatic glucose production and glucose utilization in type 1 diabetic humans. Diabetes. 35:922–926. - PubMed

Publication types

MeSH terms

LinkOut - more resources