. 2006 Sep 15;91(6):2356-70.
doi: 10.1529/biophysj.105.078121. Epub 2006 Jun 30.

Poroelastic bulk properties of the tectorial membrane measured with osmotic stress

Affiliations

Poroelastic bulk properties of the tectorial membrane measured with osmotic stress

Kinuko Masaki et al. Biophys J. .

Abstract

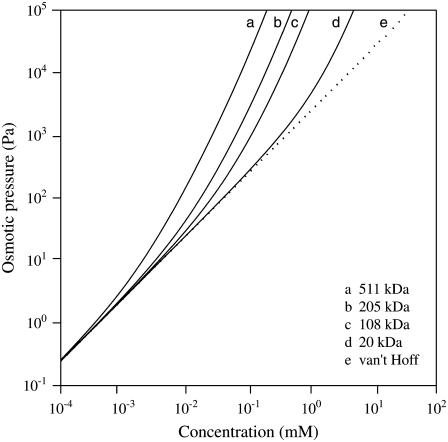
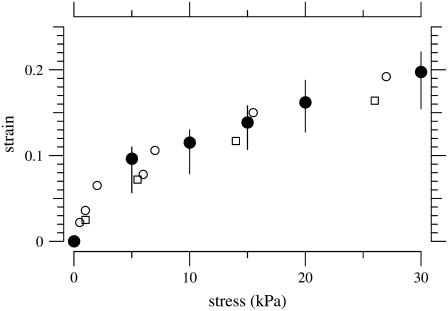
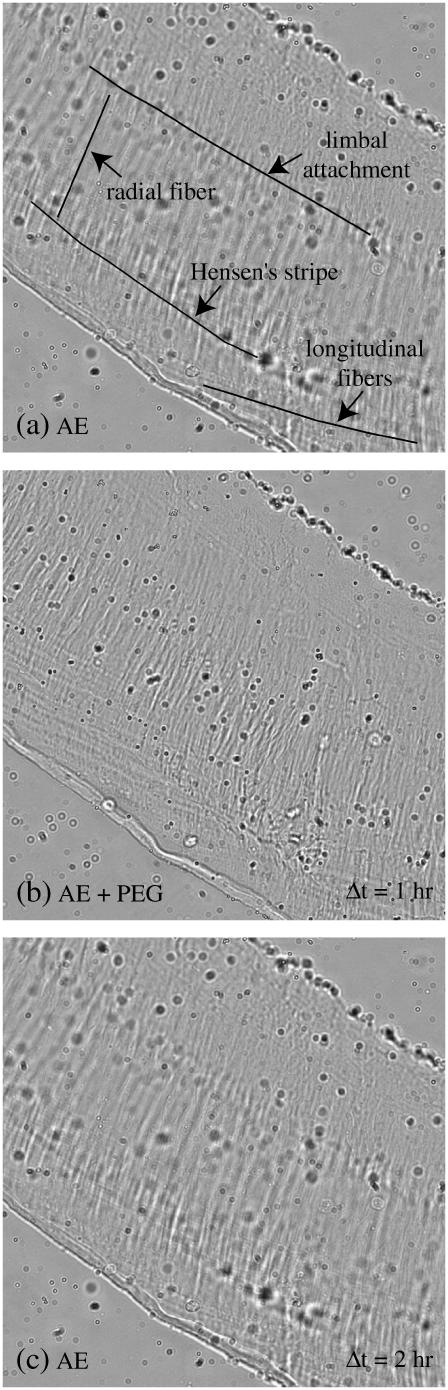
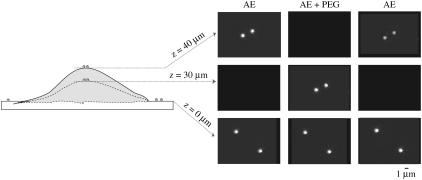
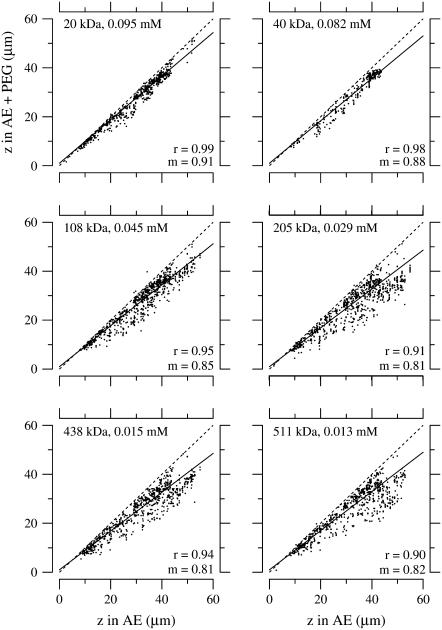
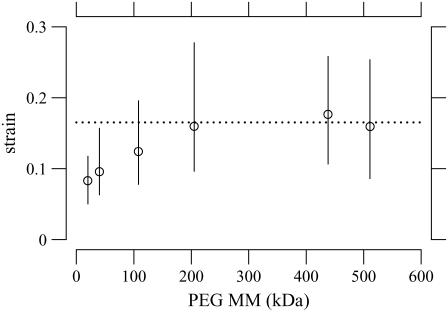
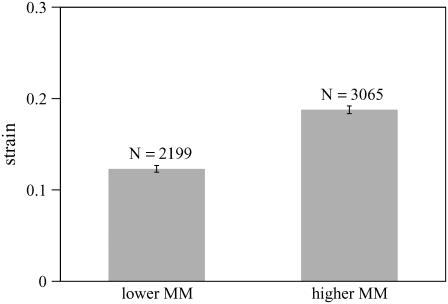
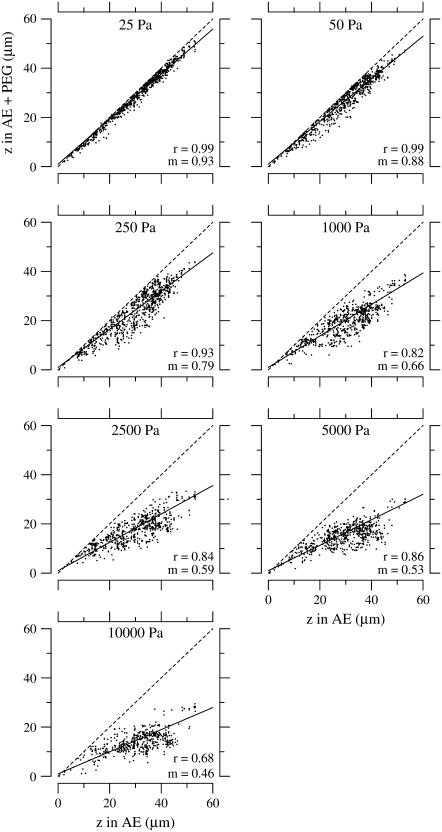
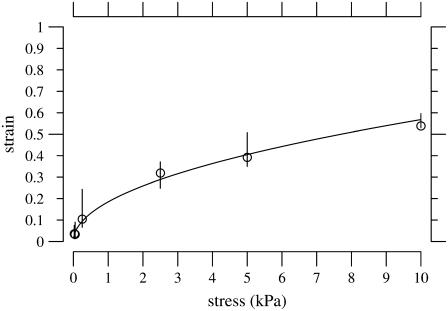
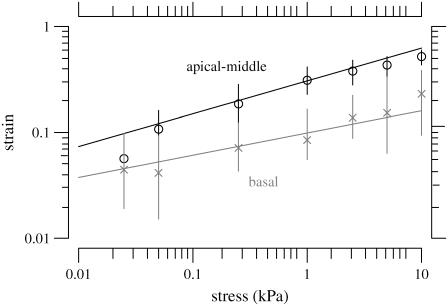
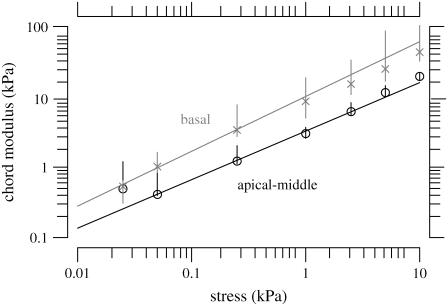
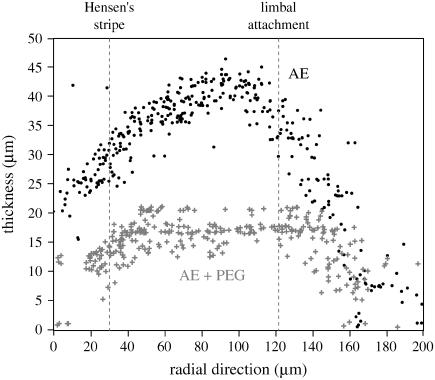
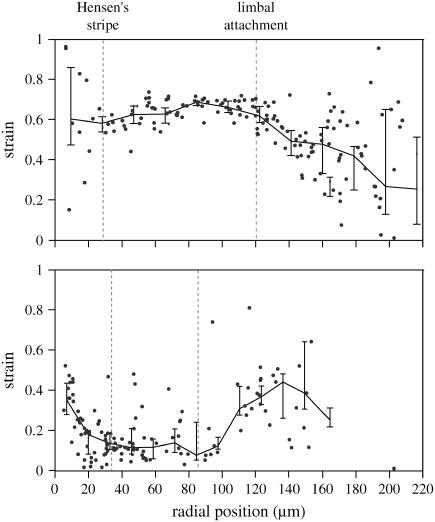
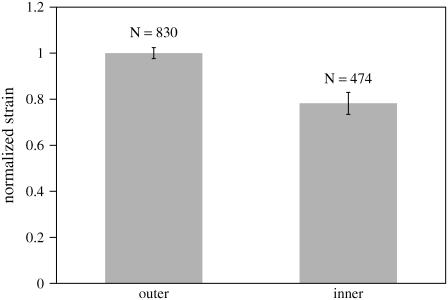
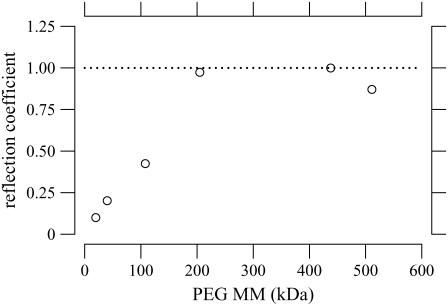
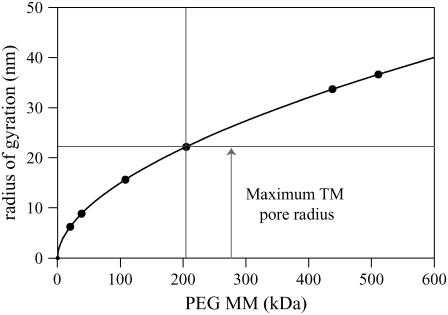
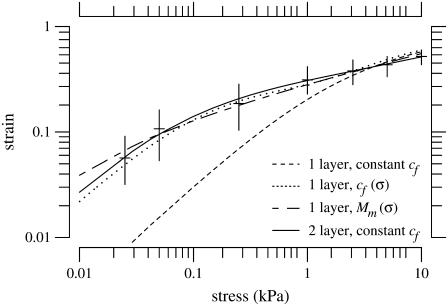
The equilibrium stress-strain relation and the pore radius of the isolated tectorial membrane (TM) of the mouse were determined. Polyethylene glycol (PEG), with molecular mass (MM) in the range 20-511 kDa, added to the TM bathing solution was used to exert an osmotic pressure. Strain on the TM induced by isosmotic PEG solutions of different molecular masses was approximately the same for MM > or = 200 kDa. However, for MM < or = 100 kDa, the TM strain was appreciably smaller. We infer that for the smaller molecular mass, PEG entered the TM and exerted a smaller effective osmotic pressure. The pore radius of the TM was estimated as 22 nm. The equilibrium stress-strain relation of the TM was measured using PEG with a molecular mass of 511 kDa. This relation was nonlinear and was fit with a power function. In the radial cochlear direction, the transverse stiffness of the TM was 20% stiffer in the inner than in the outer region. TM segments from the basal region had a larger transverse stiffness on average compared to sections from the apical-middle region. These measurements provide a quantitative basis for a poroelastic model of the TM.


Figures

FIGURE 1
FIGURE 1
Schematic diagram of an isolated TM decorated with fluorescent beads. The x, y, z coordinates of bead locations are defined as shown.
FIGURE 2
FIGURE 2
Osmotic pressure for PEG of different molecular masses as a function of concentration. The dotted line represents the relation between osmotic pressure and concentration given by van' t Hoff's law, which is independent of molecular mass. The solid curves show the relation between pressure and concentration according to Eqs. 7–9 with T = 298 K.
FIGURE 3
FIGURE 3
Equilibrium stress-strain relation of a PMAA gel. The solid circles represent the median value of the strain for a given stress applied using PEG solutions to exert osmotic pressure. The vertical lines shows the interquartile ranges. The solutions contained 174 mM KCl. The open symbols represent the stress-strain relation measured using hydraulic pressure with a dynastat in different KCl concentrations; open circles and open squares represent KCl concentration of 100 mM and 200 mM, respectively (30).
FIGURE 4
FIGURE 4
Bright-field images of the TM when exposed to (a) AE; (b) AE + PEG with a molecular mass of 511 kDa at a concentration required to apply an osmotic pressure of 10 kPa at 1 h; and (c) AE at 2 h. Images were normalized by dividing each pixel by the average value of its neighbors in a 51 × 51 pixel region. One longitudinal and radial fiber, Hensen's stripe and limbal attachment have been traced in panel a. The value Δt, shown in the lower right of panels b and c, represents the time elapsed since the image in panel a was obtained.
FIGURE 5
FIGURE 5
The right side shows fluorescent images of two beads on the TM and two on the glass slide. The columns correspond to different bathing solutions. Each row shows images in a different focal plane. The left side shows a schematic diagram of the profile of the TM and glass slide. In AE, the beads are in focus at a height of 40 μm. When PEG is added to the AE solution, the TM shrinks and hence the two beads on the surface of the TM are in focus at 30 μm. The beads on the surface of the glass slide remain in focus at the same height in both solutions.
FIGURE 6
FIGURE 6
Effect of isosmotic solutions with different PEG molecular mass on TM thickness. Thickness (z) of TMs from the apical-middle regions in PEG solutions versus that in the absence of PEG. Each solution contained AE. Different concentrations of PEG were added to each solution so that the osmotic pressure exerted by that particular molecular-weight PEG was equal to 250 Pa according to Eqs. 7–9. Each dot represents one bead on one of three TMs. The solid and dashed lines represent a regression line fit to the data and a line of unity slope, respectively. The values of the slope and correlation coefficient of the regression lines are given by m and r, respectively.
FIGURE 7
FIGURE 7
TM strain as a function of PEG molecular mass for an applied osmotic pressure of 250 Pa. This plot summarizes data from the same experiments as in Fig. 6. The circles represents the median strain. The lengths of the solid vertical lines indicate the interquartile ranges of the measurements. The horizontal line is at a strain of 0.16, which is the average value for MM ≥ 200 kDa.
FIGURE 8
FIGURE 8
Histogram of strain for two ranges of molecular mass; same data as in Fig. 7. The lower molecular mass includes all the data for MM ≤ 100 kDa and the higher molecular mass includes all the data for MM ≥ 200 kDa. The height of each bar equals the mean strain and the vertical line segments have lengths that equal twice the standard error of the mean. N is the number of data points.
FIGURE 9
FIGURE 9
Effect of osmotic pressure on TM thickness. Thickness (z) of the TM in PEG solutions versus that in the absence of PEG. Only apical-middle segments of the TM were used. The PEG solutions were made with PEG with a molecular mass of 511 kDa. Each dot represents one bead on one of the 11 TMs. The solid and dashed lines represent a regression line fit to the data and a line of unity slope, respectively. The values of the slope and correlation coefficient of the regression lines are given by m and r, respectively.
FIGURE 10
FIGURE 10
Strain as a function of applied stress for a TM segment from the apical-middle region. The strain was computed from the fractional change in TM thickness by Eq. 5. The plot symbols are the median strains and the lengths of the vertical lines show the interquartile ranges of the measurements. The solid line is a power function fit to the data according to Eq. 10 with a = 0.24 and b = 0.36.
FIGURE 11
FIGURE 11
TM stress-strain functions for all of the basal and apical-middle segments of the TM. Plot symbols represent the median strains and the lengths of vertical lines show the interquartile ranges. The solid line is a power law fit to the data according to Eq. 10 with a = 0.31 and b = 0.31 for the apical-middle segments and a = 0.10 and b = 0.21 for the basal segments. The basal data are shaded to help distinguish them from the apical-middle data.
FIGURE 12
FIGURE 12
The chord longitudinal modulus defined by Eq. 11 was computed for all 11 apical-middle and all five basal segments. Plot symbols represent the median strain and the lengths of vertical lines show the interquartile ranges. The lines through the data are regression lines fit to the basal and apical-middle data whose parameters are given in Table 1. The basal data are shaded to help distinguish them from the apical-middle data.
FIGURE 13
FIGURE 13
Example of the effect of osmotic pressure on TM thickness in the radial direction for one TM from the apical-middle region of the TM. Each dot represents the height of one bead on the TM when the TM is bathed in AE. The shaded (+) symbols show the height of the same beads when the TM is immersed in AE plus PEG. A concentration of PEG, with a molecular mass of 511 kDa, was used to produce an osmotic pressure of 10 kPa. Radial distance was measured from the outer edge toward the modiolus. The locations of anatomical landmarks are indicated by dotted vertical lines.
FIGURE 14
FIGURE 14
Strain as a function of radial position. These are examples of strain as a function of radial position measured from the outer to the inner edge of the TM at a stress of 10 kPa for two TMs. The thin lines connect the median strains computed in 20-μm bins; the vertical line segments represent the interquartile ranges of the measurements in the bins. The top panel is from the same data as shown in Fig. 13. The bottom panel shows the radial dependence of strain for a different TM. The locations of anatomical landmarks are indicated by dotted vertical lines.
FIGURE 15
FIGURE 15
Strain as a function of radial position from seven TMs at an osmotic pressure of 10 kPa. For each TM segment, we computed the strain of all points located on the outer segment of the TM from the limbal attachment. We computed the mean of these values and normalized the strains to this mean value. The height of each bar equals the mean strain and the vertical line segments have lengths that equal twice the standard error of the mean. The value N is the number of data points.
FIGURE 16
FIGURE 16
Reflection coefficient versus molecular mass of PEG solution. The reflection coefficient was computed from the median strain in Fig. 7 using Eq. 14 under the assumption that the maximum reflection coefficient was one.
FIGURE 17
FIGURE 17
Radius of gyration versus molecular mass of PEG as calculated from Eqs. 16 and 17 (solid line). The data points are the values of the radius of gyration for each molecular mass of PEG used in our experiments.
FIGURE 18
FIGURE 18
Comparison of longitudinal moduli of several connective tissues (,–65).
FIGURE 19
FIGURE 19
Least-squares fit of data for: one-layer gel model with constant fixed-charge concentration (cf) (dashed line); one-layer gel model with a cf that depends on stress (dotted line); one-layer gel model with microscopic longitudinal modulus (Mm) that depends on stress (short-long dashed line); and two-layer gel model with constant cf (solid line). All of these models except for the one-layer model with varying Mm have a Mm of 0 kPa. The best fit to the one-layer gel model had a cf of −30 mmol/L. The one-layer gel with variable cf, had a cf that varied from −11.75 mmol/L at low stress levels to –27.75 mmol/L at high stress levels according to the function, cf = 28 – 17e−1.2σ. The one-layer gel with varying Mm had a Mm that depended on stress as Mm = 3.39eσ. In this fit, cf was –27.5 mmol/L. For the fit to the two-layer gel model, layer 1 is 40% of total volume of the gel and has cf of –6 mmol/L; layer 2 is 60% of the gel and has cf of −78 mmol/L.

Similar articles

Cited by

References

    1. McGuirt, W. T., S. D. Prasad, A. J. Griffith, H. Kunst, G. E. Green, K. B. Shpargel, C. Runge, C. Huybrechts, R. F. Mueller, E. Lynch, M. C. King, H. G. Brunner, C. Cremers, M. Takanosu, S. W. Li, M. Arita, R. Mayne, D. J. Prockop, G. Van Camp, and R. Smith. 1999. Mutations in COL11A2 cause non-syndromic hearing loss (DFNA13). Nat. Genet. 23:413–419. - PubMed
    1. Legan, P. K., V. A. Lukashkina, R. J. Goodyear, M. Kossl, I. J. Russell, and G. P. Richardson. 2000. A targeted deletion of α-tectorin reveals that the tectorial membrane is required for the gain and timing of cochlear feedback. Neuron. 28:273–285. - PubMed
    1. Legan, P. K., V. A. Lukashkina, R. J. Goodyear, A. N. Lukashkin, K. Verhoeven, G. V. Camp, I. J. Russell, and G. P. Richardson. 2005. A deafness mutation isolates a second role for the tectorial membrane in hearing. Nat. Neurosci. 8:1035–1042. - PubMed
    1. Simmler, M. C., M. Cohen-Salmon, A. El-Amraoui, L. Guillaud, J. C. Benichou, C. Petit, and J. J. Panthier. 2000. Targeted disruption of otog results in deafness and severe imbalance. Nat. Genet. 24:139–143. - PubMed
    1. Davis, H. 1958. A mechano-electrical theory of cochlear action. Ann. Otol. Rhinol. Laryngol. 67:789–801. - PubMed

Publication types

Substances