A kinetic model describing the processivity of myosin-V
- PMID: 16815911
- PMCID: PMC1562393
- DOI: 10.1529/biophysj.105.070888
A kinetic model describing the processivity of myosin-V
Abstract
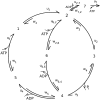
The precise details of how myosin-V coordinates the biochemical reactions and mechanical motions of its two head elements to engineer effective processive molecular motion along actin filaments remain unresolved. We compare a quantitative kinetic model of the myosin-V walk, consisting of five basic states augmented by two further states to allow for futile hydrolysis and detachments, with experimental results for run lengths, velocities, and dwell times and their dependence on bulk nucleotide concentrations and external loads in both directions. The model reveals how myosin-V can use the internal strain in the molecule to synchronize the motion of the head elements. Estimates for the rate constants in the reaction cycle and the internal strain energy are obtained by a computational comparison scheme involving an extensive exploration of the large parameter space. This scheme exploits the fact that we have obtained analytic results for our reaction network, e.g., for the velocity but also the run length, diffusion constant, and fraction of backward steps. The agreement with experiment is often reasonable but some open problems are highlighted, in particular the inability of such a general model to reproduce the reported dependence of run length on ADP concentration. The novel way that our approach explores parameter space means that any confirmed discrepancies should give new insights into the reaction network model.
Figures


Similar articles
-
Detachment, futile cycling, and nucleotide pocket collapse in myosin-V stepping.Phys Rev E Stat Nonlin Soft Matter Phys. 2015 Feb;91(2):022717. doi: 10.1103/PhysRevE.91.022717. Epub 2015 Feb 25. Phys Rev E Stat Nonlin Soft Matter Phys. 2015. PMID: 25768541
-
Characteristics of Myosin V Processivity.IEEE/ACM Trans Comput Biol Bioinform. 2019 Jul-Aug;16(4):1302-1308. doi: 10.1109/TCBB.2017.2669311. Epub 2017 Feb 14. IEEE/ACM Trans Comput Biol Bioinform. 2019. PMID: 28212094
-
Coarse-grained modeling of conformational transitions underlying the processive stepping of myosin V dimer along filamentous actin.Proteins. 2011 Jul;79(7):2291-305. doi: 10.1002/prot.23055. Epub 2011 May 16. Proteins. 2011. PMID: 21590746
-
Molecular motors: thermodynamics and the random walk.Proc Biol Sci. 2001 Oct 22;268(1481):2113-22. doi: 10.1098/rspb.2001.1764. Proc Biol Sci. 2001. PMID: 11600075 Free PMC article. Review.
-
Five models for myosin V.Front Biosci (Landmark Ed). 2009 Jan 1;14(6):2269-84. doi: 10.2741/3378. Front Biosci (Landmark Ed). 2009. PMID: 19273200 Review.
Cited by
-
Chemomechanical coupling and motor cycles of myosin V.Biophys J. 2011 Apr 6;100(7):1747-55. doi: 10.1016/j.bpj.2011.02.012. Biophys J. 2011. PMID: 21463588 Free PMC article.
-
Kinetic control of stationary flux ratios for a wide range of biochemical processes.Proc Natl Acad Sci U S A. 2020 Apr 21;117(16):8884-8889. doi: 10.1073/pnas.1920873117. Epub 2020 Apr 7. Proc Natl Acad Sci U S A. 2020. PMID: 32265281 Free PMC article.
-
A branched kinetic scheme describes the mechanochemical coupling of Myosin Va processivity in response to substrate.Biophys J. 2012 Aug 22;103(4):728-37. doi: 10.1016/j.bpj.2012.07.033. Biophys J. 2012. PMID: 22947934 Free PMC article.
-
Dynamics of ATP-dependent and ATP-independent steppings of myosin-V on actin: catch-bond characteristics.J R Soc Interface. 2020 Apr;17(165):20200029. doi: 10.1098/rsif.2020.0029. Epub 2020 Apr 8. J R Soc Interface. 2020. PMID: 32259459 Free PMC article.
-
Myosin V passing over Arp2/3 junctions: branching ratio calculated from the elastic lever arm model.Biophys J. 2008 May 1;94(9):3405-12. doi: 10.1529/biophysj.107.120568. Epub 2008 Jan 25. Biophys J. 2008. PMID: 18223006 Free PMC article.
References
-
- Sellers, J. R. 1999. Myosins, 2nd Ed. Oxford University Press, Oxford.
-
- Howard, J. 2001. Mechanics of Motor Proteins and the Cytoskeleton. Sinauer Associates, Sunderland, MA.
-
- Bray, D. 2001. Cell Movements: From Molecules to Motility, 2nd Ed. Garland, New York.
-
- Lymn, R. W., and E. W. Taylor. 1971. Mechanism of adenosine triphosphate hydrolysis by actomyosin. Biochemistry. 10:4617–4624. - PubMed
Publication types
MeSH terms
Substances
LinkOut - more resources
Full Text Sources

