

CIRSE: a solvation energy estimator compatible with flexible protein docking and design applications
- PMID: 16815913
- PMCID: PMC2242569
- DOI: 10.1110/ps.051985106
CIRSE: a solvation energy estimator compatible with flexible protein docking and design applications
Abstract
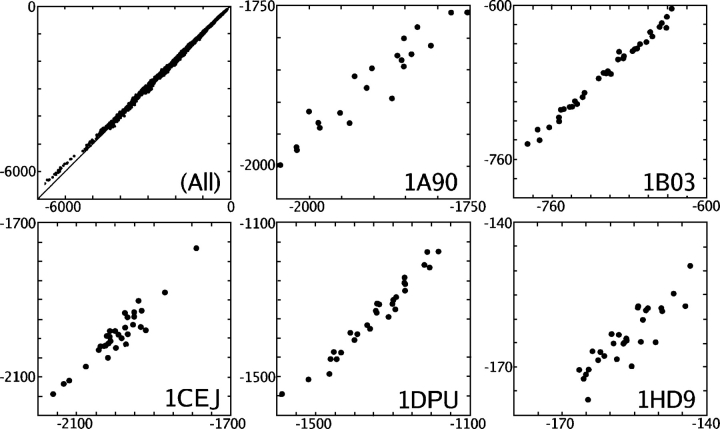
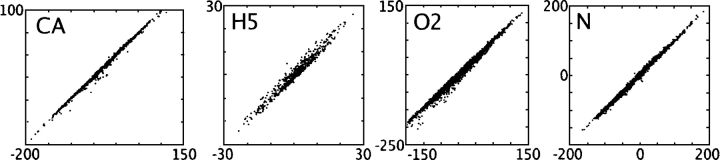
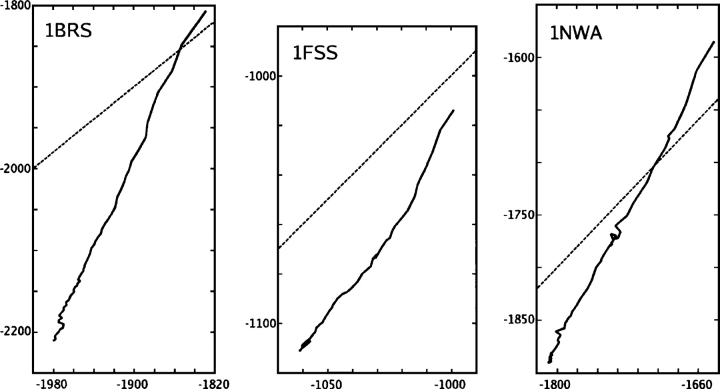
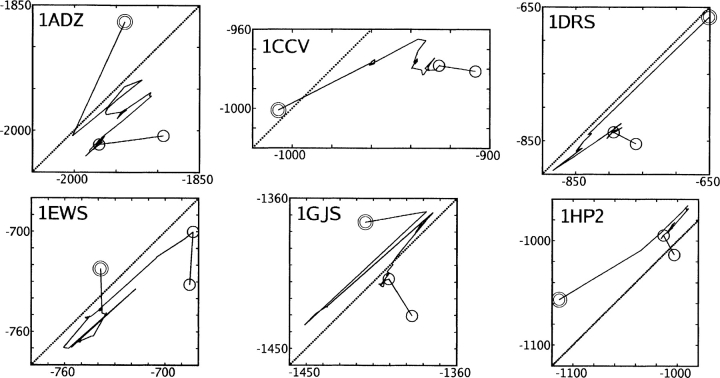
We present the Coordinate Internal Representation of Solvation Energy (CIRSE) for computing the solvation energy of protein configurations in terms of pairwise interactions between their atoms with analytic derivatives. Currently, CIRSE is trained to a Poisson/surface-area benchmark, but CIRSE is not meant to fit this benchmark exclusively. CIRSE predicts the overall solvation energy of protein structures from 331 NMR ensembles with 0.951+/-0.047 correlation and predicts relative solvation energy changes between members of individual ensembles with an accuracy of 15.8+/-9.6 kcal/mol. The energy of individual atoms in any of CIRSE's 17 types is predicted with at least 0.98 correlation. We apply the model in energy minimization, rotamer optimization, protein design, and protein docking applications. The CIRSE model shows some propensity to accumulate errors in energy minimization as well as rotamer optimization, but these errors are consistent enough that CIRSE correctly identifies the relative solvation energies of designed sequences as well as putative docked complexes. We analyze the errors accumulated by the CIRSE model during each type of simulation and suggest means of improving the model to be generally useful for all-atom simulations.
Figures

Similar articles
-
Rapid refinement of protein interfaces incorporating solvation: application to the docking problem.J Mol Biol. 1998 Feb 13;276(1):265-85. doi: 10.1006/jmbi.1997.1519. J Mol Biol. 1998. PMID: 9514726
-
Application of the frozen atom approximation to the GB/SA continuum model for solvation free energy.J Comput Chem. 2002 Jan 30;23(2):214-21. doi: 10.1002/jcc.1167. J Comput Chem. 2002. PMID: 11924735
-
An extended aqueous solvation model based on atom-weighted solvent accessible surface areas: SAWSA v2.0 model.J Mol Model. 2005 Feb;11(1):26-40. doi: 10.1007/s00894-004-0214-9. Epub 2004 Nov 24. J Mol Model. 2005. PMID: 15565273
-
Prediction of the binding energy for small molecules, peptides and proteins.J Mol Recognit. 1999 May-Jun;12(3):177-90. doi: 10.1002/(SICI)1099-1352(199905/06)12:3<177::AID-JMR451>3.0.CO;2-Z. J Mol Recognit. 1999. PMID: 10398408 Review.
-
Free-energy analysis of protein solvation with all-atom molecular dynamics simulation combined with a theory of solutions.Curr Opin Struct Biol. 2017 Apr;43:45-54. doi: 10.1016/j.sbi.2016.10.005. Epub 2016 Nov 9. Curr Opin Struct Biol. 2017. PMID: 27835803 Review.
Cited by
-
Solvent reaction field potential inside an uncharged globular protein: a bridge between implicit and explicit solvent models?J Chem Phys. 2007 Oct 21;127(15):155101. doi: 10.1063/1.2771171. J Chem Phys. 2007. PMID: 17949217 Free PMC article.
-
Improving the solubility, activity, and stability of reteplase using in silico design of new variants.Res Pharm Sci. 2019 Aug;14(4):359-368. doi: 10.4103/1735-5362.263560. Res Pharm Sci. 2019. PMID: 31516513 Free PMC article.
References
-
- Beglov D. and Roux B. 1996. Solvation of complex molecules in a polar liquid: An integral equation theory. J. Chem. Phys. 104: 8678–8689.
-
- Berendsen H.J.C., van der Spoel D., van Drunen R. 1995. GROMACS: A message-passing molecular dynamics implementation. Comput. Phys. Commun. 91: 43–45.
-
- Born M. 1920. Volumen und hydratation swärme der lonen. Z. Phys. A 1: 45–48.
Publication types
MeSH terms
Substances
LinkOut - more resources
Full Text Sources
