. 2006 Jul;15(7):1638-52.
doi: 10.1110/ps.052056006.

Sequence of events in folding mechanism: beyond the Gō model

Affiliations

Sequence of events in folding mechanism: beyond the Gō model

Ludovico Sutto et al. Protein Sci. 2006 Jul.

Abstract

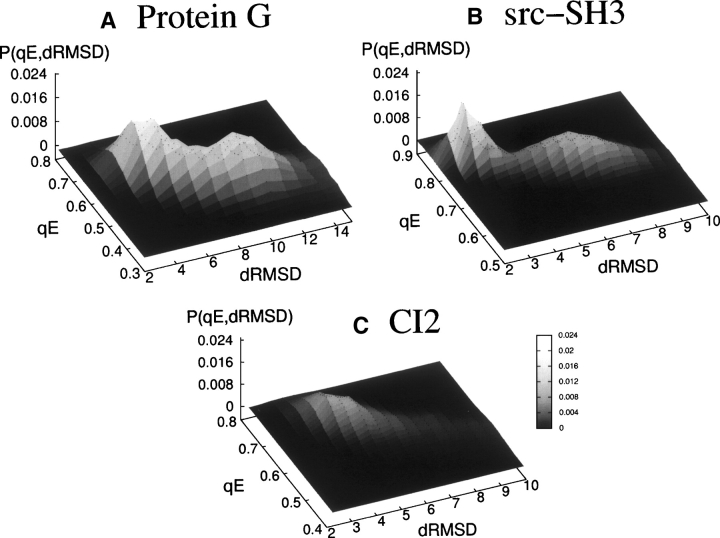
Simplified Gō models, where only native contacts interact favorably, have proven useful to characterize some aspects of the folding of small proteins. The success of these models is limited by the fact that all residues interact in the same way so that the folding features of a protein are determined only by the geometry of its native conformation. We present an extended version of a Calpha-based Gō model where different residues interact with different energies. The model is used to calculate the thermodynamics of three small proteins (Protein G, Src-SH3, and CI2) and the effect of mutations (DeltaDeltaGU-N, DeltaDeltaGdouble dagger-N, DeltaDeltaGdouble dagger-U, and phi-values) on the wild-type sequence. The model allows us to investigate some of the most controversial areas in protein folding, such as its earliest stages and the nature of the unfolded state, subjects that have lately received particular attention.


Figures

Figure 1.
Figure 1.
A cartoon representation of proteins G, Src-SH3, and CI2 (images created using VMD software [Humphrey et al. 1996]). Highlighted in dark gray are the fragments of the protein corresponding to the LES of the protein and thus containing, on average, the residues with the most stable and early forming contacts. (A) Protein G: Formed by 56 residues arranged in four β-motifs (β1 [1–9], β2 [12–20], β3 [43–46], and β4 [50–56]) an α-helix (α1 [23–36]), and four turns (Turn 1 [10,11], Turn 2 [21,22], Turn 3 [37–41], and Turn 4 [47–49]). The LES are S1 (4–9), S2 (41–46), and S3 (49–54). They contain essentially all of the hot amino acids (26, 41, 45, 52, 54) (see Fig. 4) and about half of the warm amino acids (6, 7, 20, 31, 34, 35, 51, 53) (see Fig. 4). The docking S2–S3 (essentially equivalent to the docking of β3–β4) leads to a closed LES (see text and Table 2, as well as Broglia and Tiana 2001b). We have thus also colored Turn 4, although strictly speaking, it does not belong to any of the LES. (B) Protein Src-SH3: It is formed by 60 residues arranged as follows; β1 (2–6), RT loop (8–19), diverging turn (20–27), β2 (24–28), β3 (36–41), distal hairpin (36–51), β4 (47–51), 310-helix (51–54), and β5 (54–57). The LES are S1 (3–10), S2 (18–26), S3 (36–44), and S4 (47–51). They contain all of the hot (10, 18, 20, 26, 50) and warm (5, 7, 23, 24, 38, 41, 44, 48, 49, 51) amino acids (see Fig. 5). The docking of S3–S4 LES gives rise to a closed LES and stabilizes the distal hairpin. Even if all of its amino acids do not belong to S3 + S4 (i.e., 42–46), we have colored the whole motif, (clearer tone used for amino acids outside S3 + S4). The docking of S1–S2 gives rise to a second (closed) LES, leading also to the formation of the RT loop and the diverging turn (see Table 3). Thus, we have also colored the fragment 11–17 (with a clearer tone), although this fragment of the protein does not strictly belong to any of the LES. (C) Protein CI2: Formed by 64 residues arranged in the following motifs: β1 (3–5), β2 (10–11), α1 (12–24), β3 (28–34), reactive loop (35–44), β4 (45–52), β5 (55–58), and β6 (60–64). The LES are S1 (29–34), S2 (45–52), and S3 (55–64). They contain all of the hot amino acids of the protein (29, 47, 49, 50, 57) (see Fig.6) and most of the warm amino acids (30, 32, 34, 51, 52, 58, 60) (see Fig.6) The docking of S2–S3 gives rise to a (closed) LES. This is the reason why we have also colored (clearer tone) amino acids 53 and 54 (Turn 2), although they actually do not belong to any of the LES.
Figure 2.
Figure 2.
Energies Σj Bij (solid dots) per monomer in the native conformation of Protein G (A), Src-SH3 (B), and CI2 (C), determined by making use of the interaction energies Bij calculated from the experimental values of ΔΔGU-N (see text) in comparison with the corresponding quantities calculated using the software GROMACS (open squares).
Figure 3.
Figure 3.
The equilibrium probability of (A) Protein G (at T/Tf =1.13), (B) Src-SH3 (at T/Tf =1.1), and (C) CI2 (at T/Tf =1.05) as a function of the relative energy parameter qE and of the dRMSD. Whereas in the Protein G and the Src-SH3 the two peaks representing the native and the unfolded state are well defined, for the CI2, the peaks are smoother, indicating a less-cooperative transition between states.
Figure 4.
Figure 4.
ΔΔG‡-N, ΔΔGU-N(kin) (kcal/mol), and ϕ = 1−ΔΔG‡-N/ΔΔGU-Nexp values associated with Protein G. Black histograms correspond to experimental values of the different quantities, whereas dashed histograms correspond to the prediction of the model.
Figure 5.
Figure 5.
The same as Figure 4, calculated for Src-SH3: from above: the ΔΔG‡-N, the ΔΔGU-N(kin) in kcal/mol and the ϕ-values calculated from ϕ = 1−ΔΔG‡-N/ΔΔGU-Nexp.
Figure 6.
Figure 6.
The same as Figure 4, calculated for CI2: from above: the ΔΔG‡-N, the ΔΔGU-N(kin) in kcal/mol and the ϕ-values calculated from ϕ = 1−ΔΔG‡-N/ΔΔGU-Nexp.
Figure 7.
Figure 7.
The contact map of (A) Protein G, (B) Src-SH3, and (C) CI2 at T < Tf. The colors qualitatively indicate, in the top half of the map (labeled a) the equilibrium probability of contact formation (black corresponding to the maximum contact stability), while in the bottom half (b) the formation times of the contacts are displayed (black squares indicates a formation time of 0.1 nsec, gray squares of 10 nsec and light gray of 1 μsec).
Figure 8.
Figure 8.
Average similarity parameter [qE](t) as a function of time, which characterizes the folding dynamics of Protein G at a temperature T/Tf =0.54 (black central curve) with its exponential fit (gray central curve). The other two curves represent the formation probability pi-j(t) of contacts 44–53 (fast forming) and 5–52 (slow forming).
Figure 9.
Figure 9.
Contact formation diagram for Protein G. The black bead indicates the first residue. (I) A snapshot of the random starting conformation (t = 0, dRMSD = 23.2Å), (II) the α-helix and the contacts between β3 and β4 are formed (t = 1 nsec, dRMSD = 12.2Å), (III) the folding process proceeds with the formation of the native contacts between β1 and β2 (t = 0.76 μsec, dRMSD=12.8Å), (IV) the protein reaches its native conformation once β1-β4 dock together (t = 0.99 μsec, dRMSD = 5.3Å).
Figure 10.
Figure 10.
Contact formation diagram for Src-SH3. The black bead indicates the first residue. (I) The most local contacts and contacts between β3 and the distal hairpin get formed (t = 1 nsec, dRMSD = 19.4Å), (II) contacts between β3 sand β4 and between the n-src loop and β4 are fully stabilized (t = 5 nsec, dRMSD = 15.2Å), (III) the RT-loop assemble with the diverging turn and β1 with β2 (t = 0.33 μsec, dRMSD = 6.7Å), (IV) the main structures dock together: the RT loop with β4, β1 with β5, and β2 with β3 (t = 0.58 μsec, dRMSD = 3.0Å).
Figure 11.
Figure 11.
Contact formation diagram for CI2. The black bead indicates the first residue. (I) Formation of the most local contacts within the α-helix (t = 2 nsec, dRMSD = 21.6Å), (II) the β strands β4–β5 and β4–β6 dock together (t = 20 nsec, dRMSD = 20.8Å), (III) the formation of contacts between strands β3 and β4 closes the reactive site loop (t = 0.65 μsec, dRMSD = 18.7Å), (IV) the docking of the farther strands along the chain β1–β6 and β2–β5 brings the protein to its globular native structure. A further stabilization of the α-helix then follows (t = 1.3 μsec, dRMSD = 4.3Å).

References

    1. Abkevich V.I., Gutin A.M., Shakhnovich E.I. 1994. Specific nucleus as the transition state for protein folding. Biochemistry 33: 10026–10031. - PubMed
    1. Alexander P., Fahnestock S., Lee T., Orban J., Bryan P. 1992. Thermodynamic analysis of the folding of the streptococcal Protein G IgG-binding domains B1 and B2. Biochememistry 31: 3597–3603. - PubMed
    1. Baldwin R.L. and Rose G.D. 1999. Is protein folding hierarchic? Trends Biochem. Sci. 24: 26–33. - PubMed
    1. Berendsen H.J.C., van der Spoel D., van Drunen R. 1995. GROMACS: A message–passing parallel molecular dynamics implementation. Comput. Phys. Commun. 91: 43–55.
    1. Blanco F.G., Rivas G., Serrano L. 1994. Folding of protein G B1 domain studied by conformational characterization of fragments comprising its secondary structure. Eur. J. Biochem. 230: 634–649. - PubMed

MeSH terms

LinkOut - more resources