. 2006 Jul 11;103(28):10666-71.
doi: 10.1073/pnas.0510863103. Epub 2006 Jun 30.

Interaction of two hereditary spastic paraplegia gene products, spastin and atlastin, suggests a common pathway for axonal maintenance

Affiliations

Interaction of two hereditary spastic paraplegia gene products, spastin and atlastin, suggests a common pathway for axonal maintenance

Katia Evans et al. Proc Natl Acad Sci U S A. .

Abstract

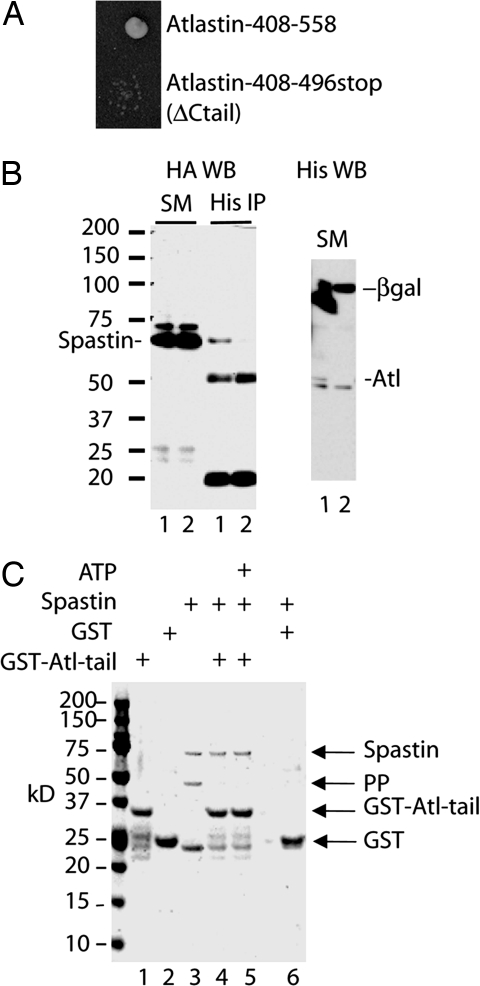
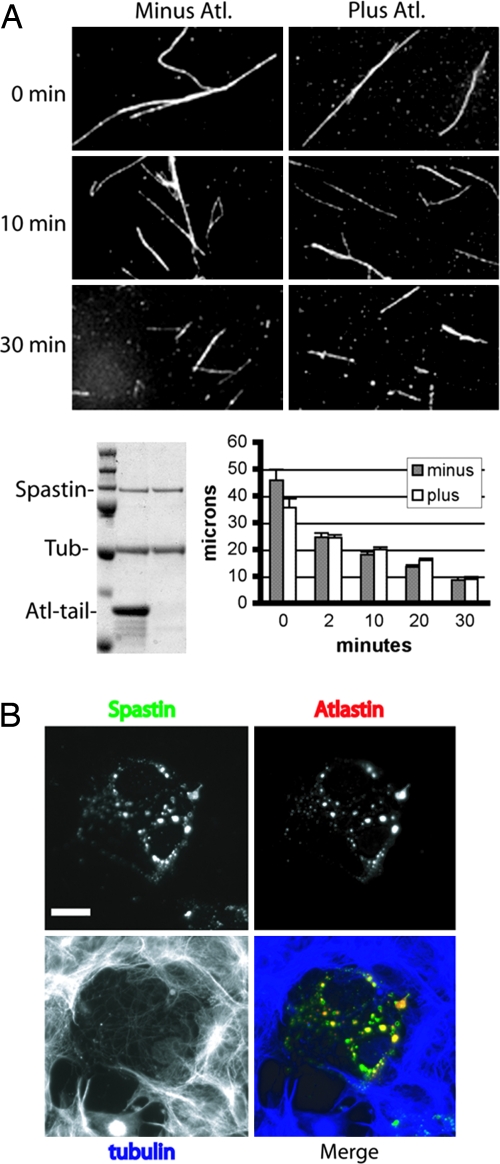
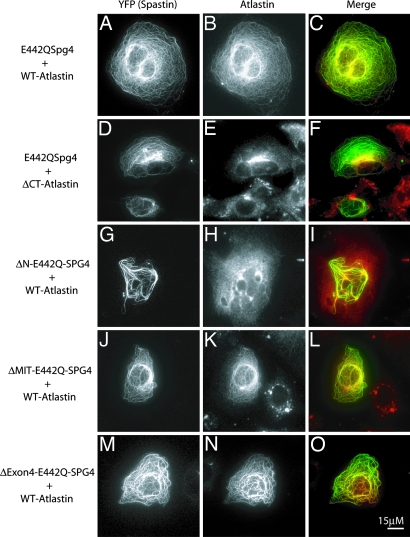
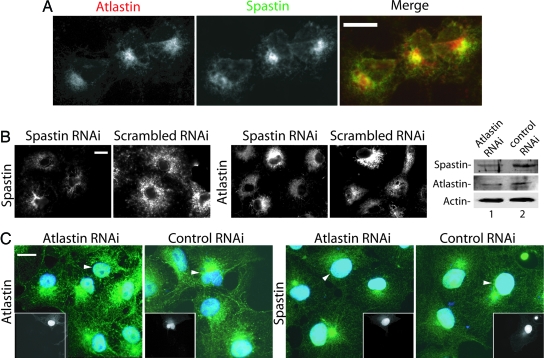
Hereditary spastic paraplegia (HSP) is a neurodegenerative disorder that is characterized by retrograde axonal degeneration that primarily affects long spinal neurons. The disease is clinically heterogeneous, and there are >20 genetic loci identified. Here, we show a physical interaction between spastin and atlastin, two autosomal dominant HSP gene products. Spastin encodes a microtubule (MT)-severing AAA ATPase (ATPase associated with various activities), and atlastin encodes a Golgi-localized integral membrane protein GTPase. Atlastin does not regulate the enzymatic activity of spastin. We also identified a clinical mutation in atlastin outside of the GTPase domain that prevents interaction with spastin in cells. Therefore, we hypothesize that failure of appropriate interaction between these two HSP gene products may be pathogenetically relevant. These data indicate that at least a subset of HSP genes may define a cellular biological pathway that is important in axonal maintenance.


Conflict of interest statement

Conflict of interest statement: No conflicts declared.

Figures

Fig. 1.
Fig. 1.
Spastin–atlastin interaction. (A) A yeast two-hybrid screen identified atlastin as a spastin interactor. Full-length human spastin was used as a bait and interacted with a clone encoding amino acids 408–558 of human atlastin-1. This clone and a deletion mutant lacking the C-tail of atlastin (ΔCtail) were used to retransform yeast in the two-hybrid assay. The original clone, but not the ΔCtail clone, interacted with spastin in this assay. (B) Coimmunoprecipitation of spastin and atlastin. HeLa cells were transiently transfected for 24 h with 2HA-spastin and either atlastin-His-6x (lysate 1) or His-6x-tagged β-gal (lysate 2) as a negative control. Cell lysates were subjected to immunoprecipitation with a His-6x antibody followed by anti-HA (Left) or anti-His-6x (Right) Western blotting. Both lysates expressed equivalent amounts of HA-spastin (SM) and spastin coimmunoprecipitated with atlastin but not β-gal. The 50- and 20-kDa bands are Ig heavy and light chains. (C) Coomassie blue-stained gel showing that spastin binds to the atlastin C-tail. The GST was cleaved from GST-spastin with precision protease (PP), and the crude reaction mixture (lane 3) containing 10 μg of spastin was applied to glutathione-Sepharose beads containing 10 μg of GST-atlastin C-tail or GST alone (lanes 4–6) in a total volume of 200 μl. Lanes 1 and 2 show samples of the beads containing only GST-atlastin C-tail or GST. All of the added spastin but none of the cleaved GST or PP bound to the atlastin C-tail, and ATP was not required for binding (compare lanes 4 and 5). In contrast to GST-spastin, the GST-atlastin C-tail protein does not contain a PP cleavage site.
Fig. 2.
Fig. 2.
Atlastin C-tail does not inhibit spastin-mediated MT severing. (A) Taxol-stabilized, rhodamine-labeled MTs and spastin were used, severing assays without or with recombinant atlastin C-tail as described in Materials and Methods. At the indicated time points, reactions were stopped by fixation in glutaraldehyde. MTs were photographed, and average lengths were calculated as described in Materials and Methods. The bar graph shows the mean lengths ± standard error. Representative photomicrographs show the extent of MT severing. There was no appreciable difference between reactions incubated with or without C-tail. The Coomassie blue-stained gel shows the relative amounts of each protein (tubulin, 0.1 mg/ml; spastin, 0.02 mg/ml). The C-tail was used at 10-fold molar excess compared with spastin. (B) Cos-7 cells were cotransfected with YFP-spastin and atlastin-FLAG. After 24 h, cells were fixed and stained with anti-FLAG and anti-tubulin antibodies. Spastin (green) and atlastin (red) colocalize. Transfected cells show decreased MT (blue) content compared with neighboring cells. (Scale bar, 15 μm.)
Fig. 3.
Fig. 3.
Spastin–atlastin interaction in cells. In Cos-7 cells cotransfected with YFP-E442Q spastin and atlastin-FLAG, atlastin is “recruited” to the MTs along with the spastin mutant, indicating that the two proteins interact in cells (AC). Deletion of the N-terminal region (residues 1–132) of spastin (GI), but not the MIT (residues 116–194) (JL) or exon 4 (residues 195–227) (MO) domains, prevented recruitment of atlastin. Deletion of the C-tail from atlastin prevented recruitment (DF).
Fig. 4.
Fig. 4.
Colocalization of endogenous spastin and atlastin. (A) Cos cells were stained with antibodies to atlastin and spastin. Signals were detected by using a Cy-5-conjugated or Alexa Fluor 488 secondary antibody. Spastin signal was detected by using Alexa Fluor 488. Note the partial colocalization of the two proteins. Atlastin staining intensity was variable, and the spastin signal is higher in cells expressing more atlastin. (B) Spastin RNAi does not appreciably alter atlastin staining. Spastin expression (Left) was partially suppressed by transfection of a spastin-specific siRNA but not a scrambled siRNA. Transfection with a rhodamine-labeled siRNA showed that >90% of the cells are transfected (data not shown). Duplicate coverslips prepared from the same transfections were stained for endogenous atlastin (Right), which appeared unaltered. (C) Effects of atlastin RNAi on spastin. Cells were fixed 48 h after transfection, and duplicate coverslips were stained for either spastin or atlastin. In this experiment, background staining of nuclei was sometimes observed. Transfected cells, identified by GFP expression (Insets), are indicated by arrowheads. Nuclei were stained with DAPI (blue). Compared with nontransfected cells, atlastin staining is partially suppressed in atlastin RNAi but not in control RNAi cells. Compared with control transfected cells, a smaller percentage of cells subjected to atlastin RNAi showed the perinuclear concentration of spastin (29% vs. 45%, n = 135 cells from each transfection). Quantitative Western blot analysis of equal numbers of transfected cells obtained by flow cytometry demonstrates that atlastin suppression was 60% and that spastin levels were also reduced to a similar degree. Signals were normalized to actin intensity. (Scale bars, 15 μm.)
Fig. 5.
Fig. 5.
The atlastin C-tail is necessary and sufficient to recruit endogenous spastin to the Golgi. Cos cells were transfected with WT atlastin-FLAG (AC), ins1688A-atlastin-FLAG (DF), or atlastin C-tail Golgi (GI) for 48 h. Cells were stained by using FLAG antibodies (Cy-5 secondary antibody in A, D, and G, shown in red) and stained for endogenous spastin (Alexa Fluor 488 detection in B, E, and H, shown in green). Note the partial colocalization of spastin with WT and atlastin C-tail Golgi but not with ins1688A-atlastin. Spastin intensity is increased in cells expressing more atlastin C-tail Golgi (compare cells in G and H). The image in E was obtained with an increased exposure time to better visualize the spastin staining. Note that spastin levels are the same in the transfected and nontransfected cells and that spastin is not localized with atlastin. The Western blot shows that cells transfected with plasmids encoding atlastin-YFP or atlastin C-tail-Golgi, but not YFP, show increased levels of endogenous spastin (shown in green). The numbers above each lane show the relative increase in spastin levels [compared with YFP transfected cells and normalized for actin expression (red)]. The graph shows spastin fluorescence intensity as a function of the atlastin-FLAG fluorescence intensity in randomly selected cells. Cells not overexpressing atlastin-FLAG had an average spastin intensity of 95 arbitrary units.

References

    1. Fink J. K. Ann. Neurol. 2002;51:669–672. - PubMed
    1. Casari G., De Fusco M., Ciarmatori S., Zeviani M., Mora M., Fernandez P., De Michele G., Filla A., Cocozza S., Marconi R., et al. Cell. 1998;93:973–983. - PubMed
    1. Hansen J. J., Durr A., Cournu-Rebeix I., Georgopoulos C., Ang D., Nielsen M. N., Davoine C. S., Brice A., Fontaine B., Gregersen N., Bross P. Am. J. Hum. Genet. 2002;70:1328–1332. - PMC - PubMed
    1. Reid E., Kloos M., Ashley-Koch A., Hughes L., Bevan S., Svenson I. K., Graham F. L., Gaskell P. C., Dearlove A., Pericak-Vance M. A., et al. Am. J. Hum. Genet. 2002;71:1189–1194. - PMC - PubMed
    1. Hazan J., Fonknechten N., Mavel D., Paternotte C., Samson D., Artiguenave F., Davoine C. S., Cruaud C., Durr A., Wincker P., et al. Nat. Genet. 1999;23:296–303. - PubMed

Publication types

MeSH terms