. 2006 Jul 15;20(14):1885-98.
doi: 10.1101/gad.1424106. Epub 2006 Jun 30.

mRNA degradation by miRNAs and GW182 requires both CCR4:NOT deadenylase and DCP1:DCP2 decapping complexes

Affiliations

mRNA degradation by miRNAs and GW182 requires both CCR4:NOT deadenylase and DCP1:DCP2 decapping complexes

Isabelle Behm-Ansmant et al. Genes Dev. .

Abstract

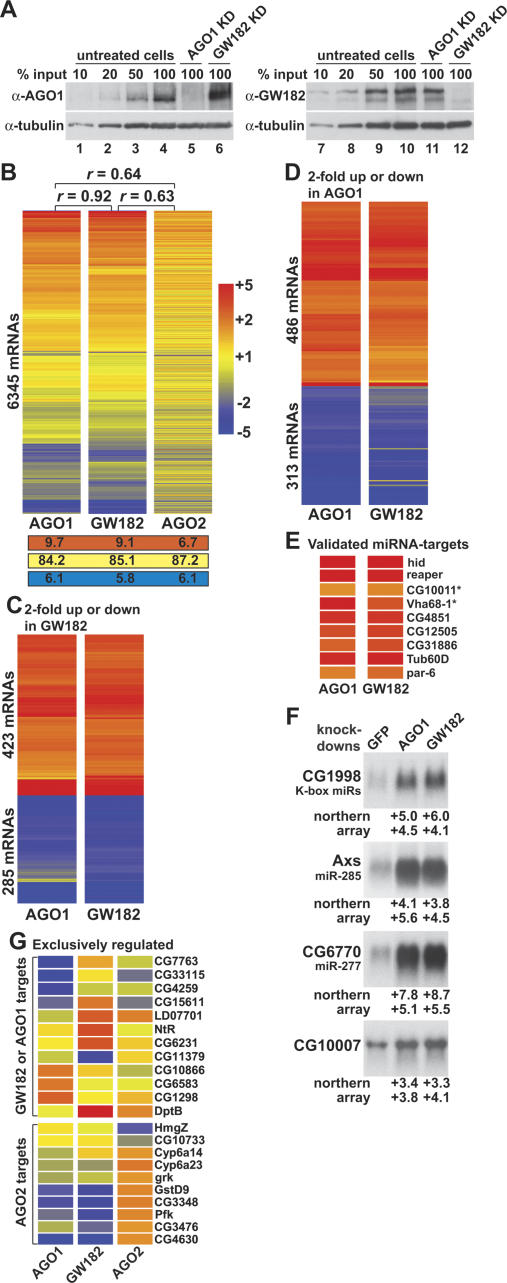
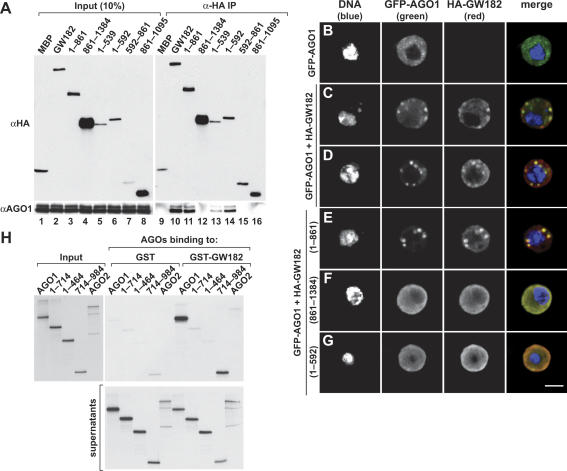
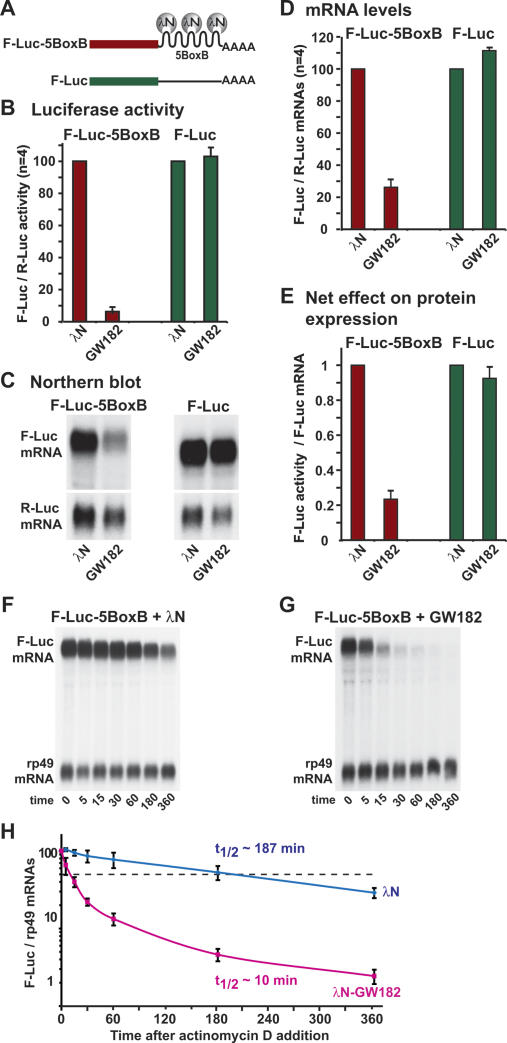
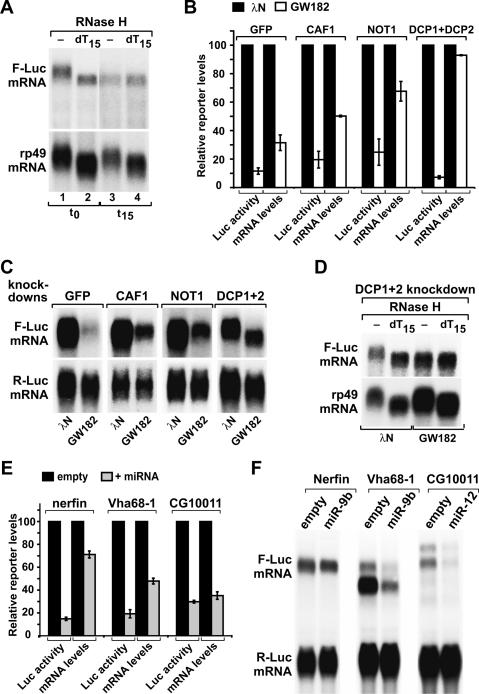
MicroRNAs (miRNAs) silence the expression of target genes post-transcriptionally. Their function is mediated by the Argonaute proteins (AGOs), which colocalize to P-bodies with mRNA degradation enzymes. Mammalian P-bodies are also marked by the GW182 protein, which interacts with the AGOs and is required for miRNA function. We show that depletion of GW182 leads to changes in mRNA expression profiles strikingly similar to those observed in cells depleted of the essential Drosophila miRNA effector AGO1, indicating that GW182 functions in the miRNA pathway. When GW182 is bound to a reporter transcript, it silences its expression, bypassing the requirement for AGO1. Silencing by GW182 is effected by changes in protein expression and mRNA stability. Similarly, miRNAs silence gene expression by repressing protein expression and/or by promoting mRNA decay, and both mechanisms require GW182. mRNA degradation, but not translational repression, by GW182 or miRNAs is inhibited in cells depleted of CAF1, NOT1, or the decapping DCP1:DCP2 complex. We further show that the N-terminal GW repeats of GW182 interact with the PIWI domain of AGO1. Our findings indicate that GW182 links the miRNA pathway to mRNA degradation by interacting with AGO1 and promoting decay of at least a subset of miRNA targets.


Figures

Figure 1.
Figure 1.
Expression profiles of Drosophila S2 cells depleted of GW182, AGO1, or AGO2. (A) S2 cells were treated with the dsRNAs indicated above the lanes. The effectiveness of the depletions was analyzed by Western blot with the antibodies indicated on the left. In lanes 1–4, dilutions of samples isolated from control cells were loaded to assess the efficacy of the depletion. Antibodies against tubulin were used as a loading control. (KD) Knockdowns. (B) Comparison of the average expression levels of the 6345 detectable transcripts in the profiles obtained for AGO1, GW182, or AGO2. The rank correlation coefficient of the profiles (r) is indicated. The table shows the percentage of transcripts at least twofold overrepresented (red), between twofold up- and down-regulated (yellow), or at least twofold underrepresented (blue). (C) Expression profiles of RNAs at least twofold overrepresented or underrepresented in the two independent profiles obtained for GW182 (Supplementary Table 1). (D) Expression profiles of RNAs at least twofold overrepresented or underrepresented in the two profiles obtained for AGO1 (Supplementary Table 1). (E) Expression profiles of validated miRNA targets. Asterisks indicate endogenous targets used to generate the miRNA reporters shown in Figure 5. (F) Validation of microarray results by Northern blot analysis. The identity of the selected transcripts and the predicted cognate miRNAs are indicated on the right. The signals from the Northern blot were normalized to rp49 mRNA (not shown). These values are compared with the values measured by microarray. Values are given as fold changes relative to the values obtained in mock-treated (cont.) cells. (G) Transcripts at least twofold regulated in either AGO1 or GW182 samples and <1.3-fold changed or inversely correlated in GW182 or AGO1 samples, respectively, and transcripts regulated exclusively by AGO2.
Figure 2.
Figure 2.
The N-terminal domain of GW182 is required for P-body targeting. (A) Domain architecture of GW182 and related proteins. (N-GW) N-terminal GW repeats; (M-GW) middle GW repeats; (C-GW) C-terminal GW repeats; (UBA) ubiquitin-associated domain; (Q-rich) region rich in glutamine; (RRM) RNA recognition motif. Orange and red boxes I and II indicate two conserved motifs within the N-terminal GW repeats. Numbers under the protein outline represent amino acid positions at fragment boundaries for the Drosophila protein. The protein domains sufficient for the localization to P-bodies and the interaction with AGO1 are indicated. (B) Confocal fluorescent micrograph of S2 cells stained with anti-GW182 antibodies. (C–F) Confocal fluorescent micrographs of S2 cells expressing HA-GW182 and/or GFP-DCP1. Bar, 5 μm.
Figure 3.
Figure 3.
The N-terminal domain of GW182 interacts with the PIWI domain of AGO1. (A) HA-GW182 or the indicated protein fragments were transiently expressed in S2 cells. Cell lysates were immunoprecipitated using anti-HA antibodies. HA-MBP served as a negative control. Inputs and immunoprecipitates were analyzed by Western blot using anti-HA or anti-AGO1 antibodies. (B–G) Epitope-tagged GFP-AGO1 was expressed in S2 cells. In C–G, the effect of cotransfecting HA-tagged versions of GW182 or the indicated protein fragments on the localization of AGO1 was examined. The merged images show the GFP signal in green, the HA signal in red, and DNA in blue. Bar, 5 μm. (H) GST pull-down assays were performed with [35S]methionine-labeled full-length AGO1, AGO2, or the indicated AGO1 protein fragments, and recombinant GST or GST-GW182 (fragment 1–592). Samples were analyzed by SDS-PAGE followed by fluorography.
Figure 4.
Figure 4.
GW182 silences the expression of bound transcripts. (A) Schematic representation of the F-Luc-5BoxB tethering reporter and of the F-Luc reporter control. (B,C) S2 cells were transfected with the F-Luc-5BoxB reporter or the F-Luc control, a plasmid expressing Renilla luciferase, and vectors expressing the λN-peptide or λN-GW182. Firefly luciferase activity was normalized to that of Renilla and set to 100 in cells expressing the λN-peptide alone. Mean values ± standard deviations from four independent experiments (n = 4) are shown. In C, the corresponding RNA samples were analyzed by Northern blot. (D) F-Luc-5BoxB or F-Luc mRNA levels were quantitated and normalized to the R-Luc transfection control in four independent experiments, including that shown in C. Normalized F-Luc mRNA levels in cells expressing the λN peptide alone were set to 100%. Mean values are shown. Error bars represent standard deviations. (E) The normalized values of firefly luciferase activity shown in B were divided by the normalized mRNA levels shown in D to estimate the net effect of tethering GW182 on protein synthesis. (F,G) S2 cells were transfected with plasmids for the λN-tethering assay. Cells were harvested at the indicated time points after addition of actinomycin D. The decay of the F-Luc-5BoxB mRNA was monitored in cells expressing the λN-peptide (F) or λN-GW182 (G). (H) The levels of the F-Luc-5BoxB mRNA normalized to rp49 mRNA in three independent experiments are plotted against time. mRNA half-lives (t1/2) calculated from the decay curves are indicated.
Figure 5.
Figure 5.
GW182 triggers decay by promoting deadenylation and decapping. (A) RNA samples shown in Figure 4G (lanes corresponding to time 0 and 15 min) were treated with RNase H in the absence or presence of oligo(dT) and analyzed by Northern blot. (B) S2 cells depleted of GFP, CAF1, NOT1, or DCP1:DCP2 were transfected with plasmids for the λN-tethering assay as described in Figure 4. F-Luc activities and mRNA levels were quantitated in three independent experiments, normalized to that of the Renilla control, and set to 100 in cells expressing the λN-peptide alone for each knockdown (black bars). (C) Northern blot of representative RNA samples corresponding to B. (D) RNA samples shown in C and corresponding to the DCP1 + 2 knockdowns were treated with RNase H in the absence or presence of oligo(dT) and analyzed by Northern blot. (E) S2 cells were transfected with plasmids expressing miRNA reporters (Nerfin, Vha68-1, or CG10011), plasmids expressing miR-9b or miR-12 (gray bars), or the corresponding empty vector (black bars), as indicated. R-Luc served as a transfection control. Firefly luciferase activity and the corresponding mRNA levels were measured and normalized to those of the Renilla control. Normalized firefly luciferase activities and mRNA levels in cells transfected with the empty vector (black bars) were set to 100%. Error bars represent standard deviations from at least three independent experiments. (F) Northern blot of representative samples shown in E.
Figure 6.
Figure 6.
mRNA decay triggered by miRNAs occurs by a deadenylation and decapping mechanism requiring GW182. (A,B) S2 cells depleted of GFP, AGO1, GW182, CAF1, NOT1, or the DCP1:DCP2 decapping complex were transfected with plasmids expressing the miRNA reporters described in Figure 5E. Firefly luciferase activity and the corresponding mRNA levels were measured and normalized to those of the Renilla control. Normalized firefly luciferase activities and mRNA levels in cells transfected with the empty vector (black bars) were set to 100% for each knockdown. Error bars represent standard deviations from three independent experiments. (C,D) Northern blot of representative samples shown in A and B. (E,F) RNA samples shown in C and D, lanes corresponding to the DCP1 + 2 knockdown, were treated with RNase H in the absence or presence of oligo(dT) and analyzed by Northern blot. (G,H) S2 cells treated with dsRNAs targeting GFP or AGO1 were transfected with plasmids for the λN-tethering assay. Firefly luciferase activity and the corresponding mRNA levels were measured and normalized to those of the Renilla control as described in Figure 5. (H) Northern blot of representative mRNA samples shown in G.
Figure 7.
Figure 7.
Endogenous miRNA targets are degraded by deadenylation and decapping. (A) S2 cells depleted of GFP, AGO1, GW182, CAF1, NOT1, or the DCP1:DCP2 decapping complex were transfected with the F-Luc-Vha68-1 reporter. Firefly luciferase activity and the corresponding mRNA levels were measured and analyzed as described in Figure 6, A and B. (B) Expression levels of endogenous Vha68-1 mRNA in cells depleted of AGO1, GW182, CAF1, or DCP1:DCP2. The signals from the Northern blot were normalized to rp49 mRNA (not shown). These values are compared with the values measured by microarray. Values are given as fold changes relative to the values obtained cells treated with GFP dsRNA. (n.d.) Not determined. (C) RNA samples shown in B, lanes corresponding to the control and the DCP1 + 2 knockdown, were treated with RNase H in the absence or presence of oligo(dT) and analyzed by Northern blot. (D,E) The decay of Vha68-1 and Axs mRNAs was monitored in depleted cells following inhibition of transcription by actinomycin D. The levels of the Vha68-1 and Axs mRNAs were normalized to rp49 mRNA and plotted against time (not shown for Vha68-1 mRNA). mRNA half-lives (t1/2) calculated from the decay curves are indicated.

Similar articles

Cited by

References

    1. Altschul S.F., Madden T.L., Schaffer A.A., Zhang J., Zhang Z., Miller W., Lipman D.J. Gapped BLAST and PSI-BLAST: A new generation of protein database search programs. Nucleic Acids Res. 1997;25:3389–3402. - PMC - PubMed
    1. Bagga S., Bracht J., Hunter S., Massirer K., Holtz J., Eachus R., Pasquinelli A.E. Regulation by let-7 and lin-4 miRNAs results in target mRNA degradation. Cell. 2005;122:553–563. - PubMed
    1. Bartel D.P. MicroRNAs: Genomics, biogenesis, mechanism, and function. Cell. 2004;116:281–297. - PubMed
    1. Ding L., Spencer A., Morita K., Han M. The developmental timing regulator AIN-1 interacts with miRISCs and may target the argonaute protein ALG-1 to cytoplasmic P bodies in C. elegans. Mol. Cell. 2005;19:437–447. - PubMed
    1. Eystathioy T., Chan E.K., Tenenbaum S.A., Keene J.D., Griffith K., Fritzler M.J. A phosphorylated cytoplasmic autoantigen, GW182, associates with a unique population of human mRNAs within novel cytoplasmic speckles. Mol. Biol. Cell. 2002;13:1338–1351. - PMC - PubMed

Publication types

MeSH terms