Comparative Study
. 2006 Aug;18(8):2021-34.
doi: 10.1105/tpc.106.043000. Epub 2006 Jun 30.

A variable cluster of ethylene response factor-like genes regulates metabolic and developmental acclimation responses to submergence in rice

Affiliations
Comparative Study

A variable cluster of ethylene response factor-like genes regulates metabolic and developmental acclimation responses to submergence in rice

Takeshi Fukao et al. Plant Cell. 2006 Aug.

Abstract

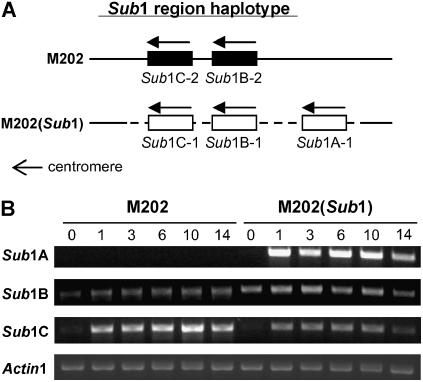
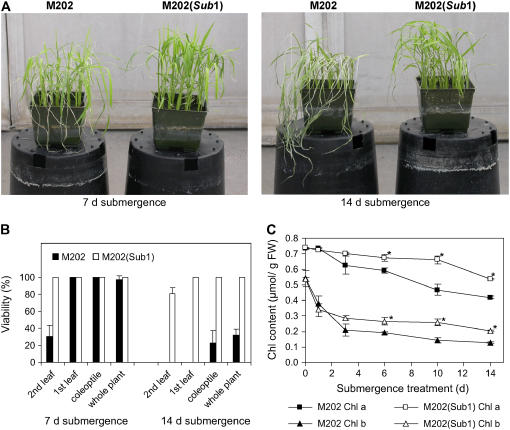
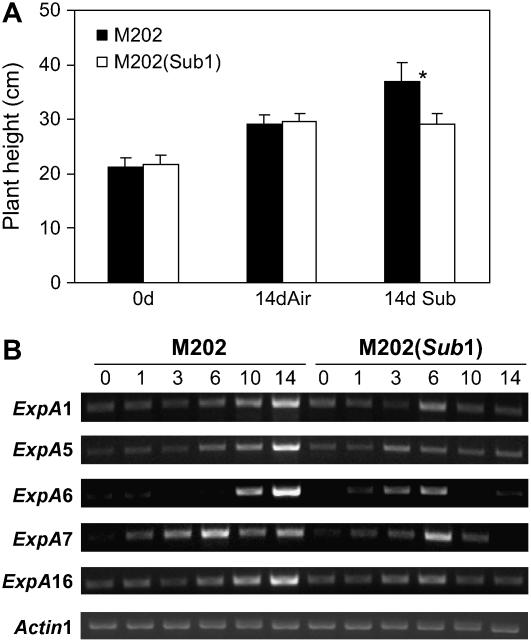
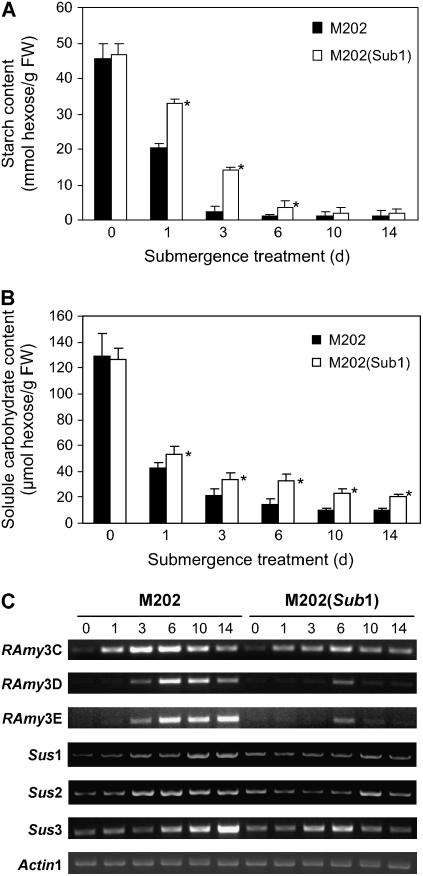
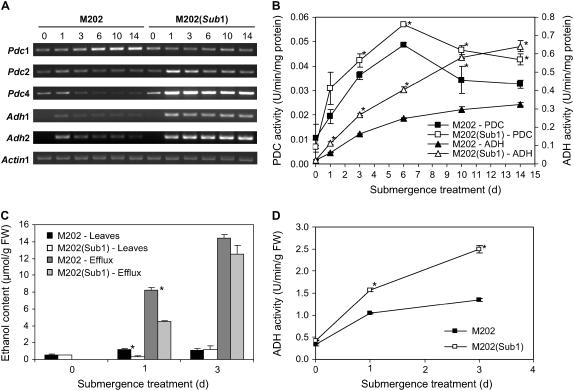
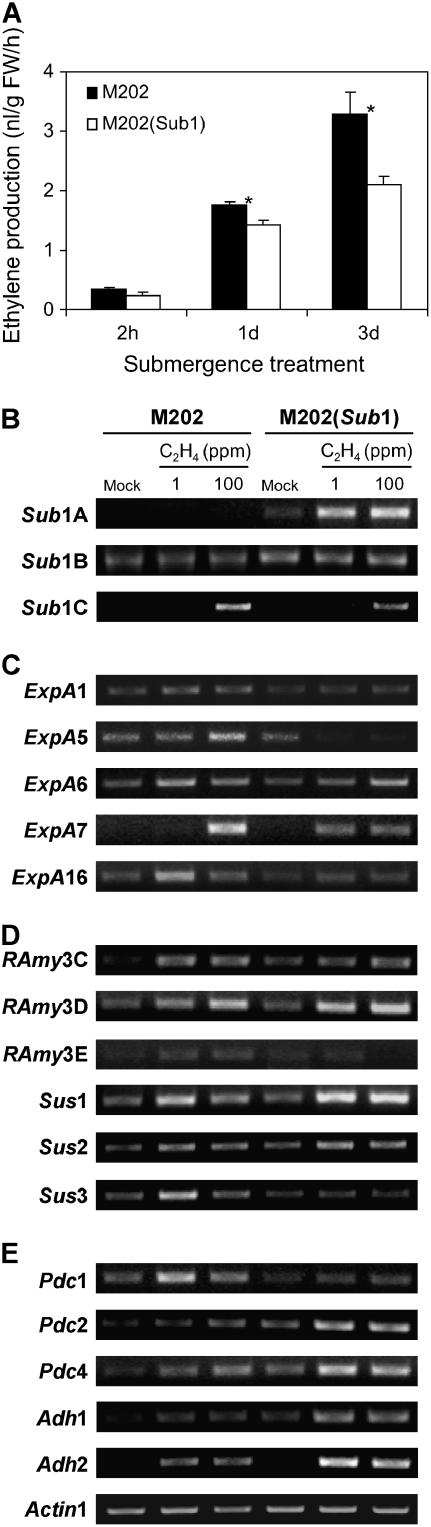
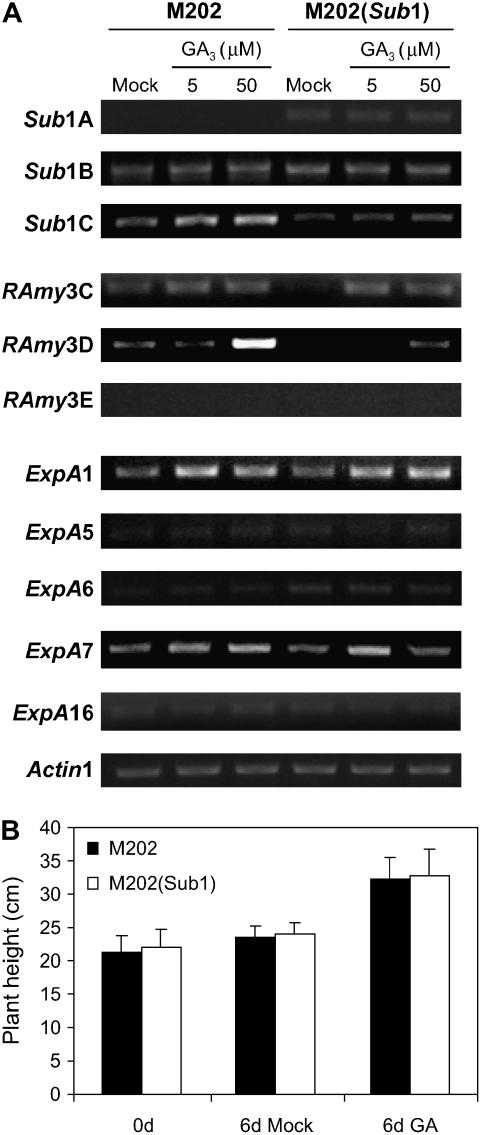
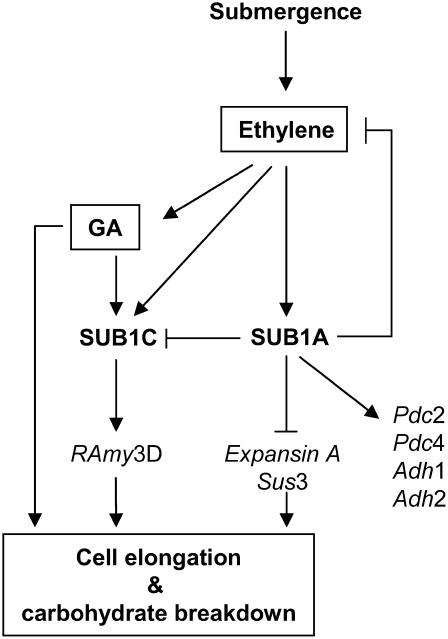
Submergence-1 (Sub1), a major quantitative trait locus affecting tolerance to complete submergence in lowland rice (Oryza sativa), contains two or three ethylene response factor (ERF)-like genes whose transcripts are regulated by submergence. In the submergence-intolerant japonica cultivar M202, this locus encodes two ERF genes, Sub1B and Sub1C. In the tolerant near-isogenic line containing the Sub1 locus from the indica FR13A, M202(Sub1), the locus additionally encodes the ERF gene Sub1A. During submergence, the tolerant M202(Sub1) displayed restrained leaf and internode elongation, chlorophyll degradation, and carbohydrate consumption, whereas the enzymatic activities of pyruvate decarboxylase and alcohol dehydrogenase were increased significantly compared with the intolerant M202. Transcript levels of genes associated with carbohydrate consumption, ethanolic fermentation, and cell expansion were distinctly regulated in the two lines. Sub1A and Sub1C transcript levels were shown to be upregulated by submergence and ethylene, with the Sub1C allele in M202 also upregulated by treatment with gibberellic acid (GA). These findings demonstrate that the Sub1 region haplotype determines ethylene- and GA-mediated metabolic and developmental responses to submergence through differential expression of Sub1A and Sub1C. Submergence tolerance in lowland rice is conferred by a specific allele variant of Sub1A that dampens ethylene production and GA responsiveness, causing quiescence in growth that correlates with the capacity for regrowth upon desubmergence.


Figures

Figure 1.
Figure 1.
Comparison of the Allele Composition and mRNA Accumulation of Sub1 Region Genes in M202 and M202(Sub1). (A) Gene and allele composition of ERF domain genes in the Sub1 region of chromosome 9. The Sub1 haplotype in M202 (japonica) consists of Sub1B-2 and Sub1C-2, whereas the genomic region in M202(Sub1) encodes Sub1A-1, Sub1B-1, and Sub1C-1 (Xu et al., 2006). The dashed line indicates the ∼182 kb introgressed from the indica accession FR13A. Arrows represent the direction of transcription for the ERF genes. (B) Analysis of Sub1 gene transcript accumulation in M202 and M202(Sub1) leaves during submergence. Fourteen-day-old plants were submerged for up to 14 d, and leaf tissue was harvested at specific time points (days 0, 1, 3, 6, 10, and 14). Total RNA was analyzed by semiquantitative RT-PCR using gene-specific primers for Sub1A, Sub1B, and Sub1C. The level of Actin1 mRNA was used as a loading control. The number of cycles for linear amplification was optimized for each primer pair. Representative results from at least three independent biological replicate experiments are shown.
Figure 2.
Figure 2.
Phenotypes of M202 and M202(Sub1) Plants after Submergence. (A) Rice plants after 7 d of recovery from submergence. Fourteen-day-old plants were submerged for 7 d (left) or 14 d (right). After submergence, plants were returned to normal growth conditions for 7 d and photographed. (B) Viability of coleoptile, first leaf, second leaf, and whole plants after desubmergence. The leaf and whole plant viability of each genotype was evaluated in the samples shown in (A). Fully green (nonchlorotic) leaves were scored as viable. Plants were scored as viable if a new leaf appeared during recovery. The data represent means ± sd from three independent biological replicates (n = 75). (C) Decrease in chlorophyll a/b content in leaves during submergence. Fourteen-day-old plants were submerged for up to 14 d, and leaf tissue was harvested at specific time points (days 0, 1, 3, 6, 10, and 14). Chlorophyll was extracted in 80% (v/v) buffered acetone and quantified by a spectrophotometer. The data represent means ± sd from three independent biological replicates. Asterisks indicate significant differences between the two genotypes (P < 0.05). FW, fresh weight.
Figure 3.
Figure 3.
Leaf Elongation in M202 Is Greater Than in M202(Sub1) Plants under Submergence. (A) Plant height after submergence treatment. Fourteen-day-old plants were grown under aerobic (Air) or submerged (Sub) conditions for 14 d. Plant height was measured at days 0 and 14. The height of plants submerged for 14 d was recorded upon desubmergence. The data represent means ± sd from three independent biological replicates (n = 75). The asterisk indicates that M202 plants after 14 d of submergence were significantly more elongated than other plants (P < 0.01). (B) Analysis of ExpA gene transcript accumulation in leaves during submergence. Fourteen-day-old plants were submerged for up to 14 d, and leaf tissue was collected at specific time points (days 0, 1, 3, 6, 10, and 14). Total RNA was analyzed by semiquantitative RT-PCR using gene-specific primers for ExpA. The level of Actin1 mRNA was used as a loading control.
Figure 4.
Figure 4.
Carbohydrate Consumption Is Accelerated in Leaves of M202 Relative to M202(Sub1) during Submergence. (A) Starch contents in leaves during submergence. Fourteen-day-old plants were submerged for up to 14 d, and leaf samples were collected at specific time points (days 0, 1, 3, 6, 10, and 14). Leaf starch content was determined by an enzymatic method. The data represent means ± sd from three independent biological replicates. Asterisks indicate significant differences between the two genotypes at that time point (P < 0.05). FW, fresh weight. (B) Total soluble carbohydrate contents in leaves during submergence. Leaf samples used for the starch assay were analyzed to determine total carbohydrate contents by the anthrone method. The data represent means ± sd from three independent biological replicates. Asterisks indicate significant differences between the two genotypes at that time point (P < 0.05). (C) Accumulation of gene transcripts associated with carbohydrate catabolism. Leaf samples analyzed for starch and total soluble carbohydrates were used to extract total RNA, which was analyzed by semiquantitative RT-PCR using gene-specific primers for α-amylases (RAmy) and sucrose synthases (Sus). The level of Actin1 mRNA was used as a loading control.
Figure 5.
Figure 5.
Ethanolic Fermentation in M202 and M202(Sub1) Leaves in Response to Submergence. (A) Accumulation of gene transcripts associated with ethanolic fermentation during submergence. Fourteen-day-old seedlings were exposed to submergence stress for up to 14 d, and leaf tissue was harvested at specific time points (days 0, 1, 3, 6, 10, and 14). Total RNA extracted from the leaf tissues was analyzed by semiquantitative RT-PCR using gene-specific primers for Pdc and Adh transcripts. The level of Actin1 mRNA was used as a loading control. (B) PDC and ADH activities in leaves during submergence. Specific activities of PDC and ADH were assayed for the leaf tissue used for RT-PCR analysis of Pdc and Adh mRNAs. The data represent means ± sd from three independent biological replicates. Asterisks indicate significant differences between the two genotypes at that time point (P < 0.05). (C) Ethanol content of leaves and surrounding medium of submerged plants. Ten-day-old plants were submerged in water in test tubes for up to 3 d. Leaf tissues and the surrounding medium were collected at days 0, 1, and 3, and their ethanol contents were quantified enzymatically. The data represent means ± sd from three independent biological replicates. Asterisks indicate significant differences between the two genotypes at that time point (P < 0.01). FW, fresh weight. (D) ADH activity in leaves used for the ethanol assay. ADH enzymatic activity was assayed in the leaf tissues used for the analysis of ethanol content. ADH values are presented on a fresh weight basis. The data represent means ± sd from three independent biological replicates. Asterisks indicate significant differences between the two genotypes at that time point (P < 0.01).
Figure 6.
Figure 6.
Ethylene Sensitivity Is Greater in Leaves of M202 Relative to M202(Sub1). (A) Ethylene production during submergence. Ten-day-old plants were submerged in water in test tubes for up to 3 d. Ethylene gas that accumulated in the headspace of the test tube was quantified by gas chromatography. The data represent means ± se from five independent biological replicates. Asterisks indicate significant differences between the two genotypes at that time point (P < 0.05). FW, fresh weight. (B) Analysis of Sub1 region gene transcript accumulation in response to ethylene. Fourteen-day-old plants were treated with 1 or 100 ppm ethylene for 6 h in the light. Total RNA was analyzed by semiquantitative RT-PCR using gene-specific primers for Sub1A, Sub1B, and Sub1C, as described for Figure 1B. (C) Analysis of ExpA gene transcript accumulation in response to ethylene. Total RNA extracted from ethylene-treated leaves was analyzed by semiquantitative RT-PCR using gene-specific primers for ExpA, as described for Figure 3. (D) Analysis of transcript levels for genes associated with carbohydrate metabolism in response to ethylene. Total RNA extracted from ethylene-treated leaves was analyzed by semiquantitative RT-PCR using gene-specific primers for α-amylases (RAmy) and sucrose synthases (Sus), as described for Figure 4. (E) Analysis of transcript levels for genes associated with ethanolic fermentation in response to ethylene. Total RNA extracted from ethylene-treated leaves was analyzed by semiquantitative RT-PCR using gene-specific primers for Pdc and Adh, as described for Figure 5. The level of Actin1 mRNA was used as a loading control for (B) to (E).
Figure 7.
Figure 7.
GA3 Sensitivity of M202 and M202(Sub1) Leaves. (A) Analysis of transcript levels for Sub1 region, α-amylase (RAmy), and ExpA genes in response to GA3. Leaves of 14-d-old plants were treated with 5 or 50 μM GA3 for 24 h. Total RNA extracted from GA3-treated leaves was analyzed by semiquantitative RT-PCR using gene-specific primers for Sub1 genes, α-amylase, and ExpA. The level of Actin1 mRNA was used as a loading control. (B) Response of plant growth to GA3. Five- or 14-d-old plants were treated with mock solution (0.1% [v/v] DMSO) or 100 μM GA3 solution in 0.1% (v/v) DMSO for 3 d. Plant height in the two genotypes was measured after 3 d of treatment. The data represent means ± sd from three independent biological replicates (n = 75).
Figure 8.
Figure 8.
Model for Ethylene- and GA-Mediated Regulation of Gene Transcripts Associated with Acclimative Responses to Submergence by SUB1A and SUB1C. Submergence triggers ethylene production and accumulation within plant cells, which promotes the accumulation of Sub1A and Sub1C transcripts. SUB1A of submergence-tolerant indica activates the expression of genes associated with ethanolic fermentation and represses the expression of genes involved in cell elongation and carbohydrate breakage. SUB1A also limits the production of ethylene during submergence, which restricts GA production and sensitivity. Repression of ethylene-mediated GA production and response results in the restriction of Sub1C mRNA accumulation as well as GA-dependent cell elongation and carbohydrate consumption. SUB1A also suppresses the accumulation of Sub1C transcript during submergence. A limitation of GA-dependent carbohydrate consumption by SUB1A may suppress α-amylase and sucrose synthase mRNA accumulation, because transcription of these genes is enhanced by sugar starvation. Consequently, SUB1A of submergence-tolerant indica regulates the ethylene- and GA-mediated gene expression responsible for carbohydrate consumption, cell elongation, and ethanolic fermentation and thereby confers submergence tolerance in lowland rice.

Similar articles

Cited by

References

    1. Armstrong, W., and Drew, M.C. (2002). Root growth and metabolism under oxygen deficiency. In Plant Roots: The Hidden Half, 3rd ed. Y. Waisel, A. Eshel, and U. Kafkafi, eds (New York: Marcel Dekker), pp. 729–761.
    1. Banga, M., Slaa, E.J., Blom, C.W., and Voesenek, L.A. (1996). Ethylene biosynthesis and accumulation under drained and submerged conditions. Plant Physiol. 112 229–237. - PMC - PubMed
    1. Baxter-Burrell, A., Chang, R., Springer, P., and Bailey-Serres, J. (2003). Gene and enhancer trap transposable elements reveal oxygen deprivation-regulated genes and their complex patterns of expression in Arabidopsis. Ann. Bot. (Lond.) 91 129–141. - PMC - PubMed
    1. Benschop, J.J., Jackson, M.B., Gühl, K., Vreeburg, R.A.M., Croker, S.J., Peeters, A.J.M., and Voesenek, A.C.J. (2005). Contrasting interactions between ethylene and abscisic acid in Rumex species differing in submergence tolerance. Plant J. 44 756–768. - PubMed
    1. Bethke, P.C., Schuurink, R., and Jones, R.L. (1997). Hormonal signaling in cereal aleurone. J. Exp. Bot. 48 1337–1356.

Publication types

MeSH terms

Associated data