Separate origins of hepatitis B virus surface antigen-negative foci and hepatocellular carcinomas in transgenic HBsAg (alb/psx) mice
- PMID: 16816375
- PMCID: PMC1698773
- DOI: 10.2353/ajpath.2006.051284
Separate origins of hepatitis B virus surface antigen-negative foci and hepatocellular carcinomas in transgenic HBsAg (alb/psx) mice
Abstract
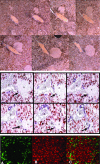
We have examined the development and transgene expression in liver lesions of transgenic mice bearing the hepatitis B surface antigen (HBsAg) gene of hepatitis B virus under the control of the albumin promoter (alb/psx) to study liver regeneration and hepatocellular carcinoma (HCC) associated with hepatitis B virus infection. Storage of the HBsAg in the endoplasmic reticulum precedes loss of liver cells and regenerative hyperplastic nodules that do not express HBsAg. Histological analysis indicated that HBsAg-negative foci and nodules arose from liver progenitor cells in the portal zone and lacked mRNA expression. Genomic DNA from eight of nine HBsAg-negative laser capture-excised liver foci showed loss of part of the alb/psx gene, whereas no loss of the actin gene was observed. The alb/psx DNA was intact in adjacent HBsAg-positive tissue. Sequencing of polymerase chain reaction products suggested that alterations in the HBsAg transgene in HBsAg-negative foci occurred via large-scale deletions as opposed to single-site mutations. Southern blot analysis of HCC from 2-year-old transgenic HBsAg mice, however, revealed an intact alb/psx gene. Thus, HBsAg-negative progenitor cells with deletions in the transgene appear to be responsible for compensatory regeneration of the liver, whereas HCCs arise from clonal expansion of hepatocytes with intact alb/psx transgenes.
Figures


Similar articles
-
Pre-S mutant surface antigens in chronic hepatitis B virus infection induce oxidative stress and DNA damage.Carcinogenesis. 2004 Oct;25(10):2023-32. doi: 10.1093/carcin/bgh207. Epub 2004 Jun 3. Carcinogenesis. 2004. PMID: 15180947
-
Different expression of hepatitis B surface antigen between hepatocellular carcinoma and its surrounding liver tissue, studied using a tissue microarray.J Pathol. 2002 Aug;197(5):610-6. doi: 10.1002/path.1150. J Pathol. 2002. PMID: 12210080
-
HBsAg-negative hepatitis B virus infections in hepatitis C virus-associated hepatocellular carcinoma.J Viral Hepat. 2005 May;12(3):325-9. doi: 10.1111/j.1365-2893.2005.00586.x. J Viral Hepat. 2005. PMID: 15850475
-
Hepatitis B virus (HBV) DNA integration in patients with occult HBV infection and hepatocellular carcinoma.Liver Int. 2015 Oct;35(10):2311-7. doi: 10.1111/liv.12807. Epub 2015 Feb 25. Liver Int. 2015. PMID: 25677098
-
Identification of a pre-S2 mutant in hepatocytes expressing a novel marginal pattern of surface antigen in advanced diseases of chronic hepatitis B virus infection.J Gastroenterol Hepatol. 2000 May;15(5):519-28. doi: 10.1046/j.1440-1746.2000.02187.x. J Gastroenterol Hepatol. 2000. PMID: 10847439 Review.
Cited by
-
Dual oncogenic and tumor suppressor roles of the promyelocytic leukemia gene in hepatocarcinogenesis associated with hepatitis B virus surface antigen.Oncotarget. 2016 May 10;7(19):28393-407. doi: 10.18632/oncotarget.8613. Oncotarget. 2016. PMID: 27058621 Free PMC article.
References
-
- American Cancer Society Atlanta, GA: American Cancer Society, Inc.; Cancer Facts and Figures, 2004. 2004
-
- El Serag HB, Mason AC. Rising incidence of hepatocellular carcinoma in the United States. N Engl J Med. 1999;340:645–750. - PubMed
-
- Ozturk M. p53 mutation in hepatocellular carcinoma after aflatoxin B1 exposure. Lancet. 1991;338:1356–1359. - PubMed
-
- Munoz N, Bosch F. Epidemiology of hepatocellular carcinoma. Okuda K, Ishak K, editors. Tokyo: Springer-Verlag,; Neoplasms of the Liver. 1987:pp 13–19.
-
- Bressac B, Kew M, Wands J, Ozturk M. Selective G to T mutations of p53 gene in hepatocellular carcinoma from Southern Africa. Nature. 1991;350:429–431. - PubMed
Publication types
MeSH terms
Substances
Grants and funding
LinkOut - more resources
Full Text Sources
Medical
Molecular Biology Databases
Miscellaneous

