. 2006 Jul;169(1):233-46.
doi: 10.2353/ajpath.2006.051152.

Role of the integrin-binding protein osteopontin in lymphatic metastasis of breast cancer

Affiliations

Role of the integrin-binding protein osteopontin in lymphatic metastasis of breast cancer

Alison L Allan et al. Am J Pathol. 2006 Jul.

Abstract

Although a primary route of breast cancer metastasis is believed to be via lymphatics, the molecular factors involved are poorly understood. We hypothesized that one such factor may be the integrin-binding protein osteopontin (OPN), and we investigated this clinically and experimentally. In breast cancer patients undergoing sentinel lymph node biopsy, OPN levels were significantly higher in lymph node metastases than in the primary tumor (P < 0.001). To test the functional contribution of OPN to lymphatic metastasis and to determine whether the RGD (Arg-Gly-Asp) integrin-binding sequence of OPN is important for this process, we transfected wild-type OPN or mutant OPN (lacking the RGD sequence) into MDA-MB-468 human breast cancer cells. In vitro, cells overexpressing OPN demonstrated increased anchorage-independent growth in soft agar (P = 0.001) and increased RGD-dependent adhesion (P = 0.045). Following mammary fat pad injection of nude mice, cells overexpressing OPN showed increased lymphovascular invasion, lymph node metastases, and lung micrometastases at earlier time points (P = 0.024). Loss of the RGD region partially abrogated this effect in the lymphatics (P = 0.038). These novel findings indicate that OPN is a key molecular player involved in lymphatic metastasis of breast cancer, potentially by affecting RGD-mediated adhesive interactions and by enhancing the establishment/persistence of tumor cells in the lymphatics.


Figures

Figure 1
Figure 1
Immunohistochemical analysis of OPN expression in primary tumors and lymph node metastases of breast cancer patients undergoing sentinel lymph node biopsy. Formalin-fixed, paraffin-embedded tumor and lymph node samples were subjected to an immunoperoxidase technique as described in the Materials and Methods. The primary antibody used was the monoclonal antibody mAb53. Immunostained slides were evaluated by light microscopy in a blinded fashion by two independent pathologists using a semiquantitative scoring system based on staining intensity (I) and proportion/extent (E) of stained tumor cells as described elsewhere. The overall amount of staining = I + E = 0 to 8 (0 for negative staining and 2 to 8 for positive staining ranges). A: OPN expression in normal breast tissue. B: OPN expression in breast tissue with dystrophic calcification. C and D: OPN expression in representative primary tumor (OPN score = 6) (C) and matched lymph node metastases (OPN score = 8) (D) from an individual lymph node-positive patient. In D, OPN expression can be observed both in tumor cells (outlined representative region in main micrograph and inset) and in the follicles/germinal centers and perifollicular areas of the surrounding lymph node. Only OPN staining localized to tumor cells was quantified. Magnification: ×400 (A and B and insets in C and D); ×100 (main micrographs C and D).
Figure 2
Figure 2
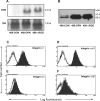
OPN and integrin expression of 468-CON, 468-OPN, and 468-ΔRGD cell lines. A: Expression of OPN mRNA was assessed by Northern blot analysis of 10 μg of total RNA/cell line. A cDNA probe specific for human OPN was radiolabeled with 32P-dCTP and hybridized to the membrane. A radiolabeled cDNA probe specific for the 18S subunit was used as a loading control. B: Expression of secreted OPN in conditioned media (CM) as assessed by Western blot analysis. A normalized volume of CM equivalent to 1 × 10⁵ cells was loaded into each lane, and equal loading was confirmed by Coomassie Blue staining (data not shown). Two typical forms of OPN were detected: high molecular weight (97 kd) and lower molecular weight (66 kd). C–F: Flow cytometry analysis of the expression of various cell-surface integrin receptors by the 468-CON cell line. Cultured cells were incubated with integrin-specific antibodies (filled profiles) or with a nonspecific isotype control primary antibody (open profiles). Filled profiles represent surface expression of integrin β1 (C), integrin αvβ5 (D), integrin β3 (E), and integrin α9β1 (F). No difference in integrin expression was seen among 468-CON, 468-OPN, 468-ΔRGD, or parental MDA-MB-468 cell lines (data not shown). Analyses were performed on RNA, conditioned media, or cells isolated from three separate experiments and gave similar results.
Figure 3
Figure 3
Differences in cell growth and cell adhesion in vitro. A: Cell growth of 468-CON (▪), 468-OPN (•), and 468-ΔRGD (▴) in standard culture conditions over time. Data are presented as the mean ± SE. B and C: Anchorage-independent cell growth of 468-CON (white bars), 468-OPN (black bars), and 468-ΔRGD (hatched bars) in 0.4% soft agar. Cells (1.0 × 10⁴ cells/60 mm plate; n = 4 for each cell line) were allowed to grow for 4 weeks. Plates were quantified with regards to the mean number of colonies per field (B) and the mean colony diameter (C) using 5 fields of view per plate. Data are presented as the mean ± SE. * Significantly different from 468-CON cells (P < 0.001). D: Cell adhesion of 468-CON, 468-OPN, and 468-ΔRGD to PBS (white bars; negative control) or 5 μg/ml vitronectin (black bars) in the presence or absence of blocking antibodies to RGD-dependent integrins (β1; vertical striped bars and αvβ5; hatched bars) or an IgG negative isotype control (diagonal striped bars). Nontissue culture 96-well dishes were used, and cells (1 × 10⁴ cells/well; n = 3 for each treatment) were allowed to adhere for 5 hours. Adhered cells were quantified by manual counting of five fields of view per well. Data are presented as the mean ± SE. * Significantly different from corresponding treatment of 468-CON cells (P < 0.05); δ significantly different from corresponding treatment of 468-ΔRGD cells (P < 0.05); Φ significantly different from respective IgG control (P < 0.05). Experiments were repeated three times and gave similar results.
Figure 4
Figure 4
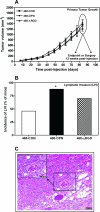
In vivo tumorigenicity and invasive behavior of 468-CON, 468-OPN, and 468-ΔRGD cells. A: Primary tumor growth kinetics. 468-CON (▪), 468-OPN (•), or 468-ΔRGD (▴) cells were injected into the second thoracic mammary fat pad of female athymic nude (nu/nu) mice using 1 × 10⁶ cells/mouse and 20–26 mice/treatment group. Tumors were measured in two dimensions twice a week for 12 weeks using standard calipers, and the tumor volume was estimated as described in the Materials and Methods. At 12 weeks after injection, mice were either subjected to surgery to remove the primary tumor or sacrificed and assessed for metastatic burden. B: Incidence of lymphovascular invasion at the site of the primary tumor in mice injected with 468-CON (white bars), 468-OPN (black bars), or 468-ΔRGD (hatched bars) cells. Tissue sections from primary tumors were subjected to histochemical staining with H&E and assessed for morphology and the incidence of lymphovascular invasion in a blinded fashion by two independent pathologists. *, Significantly different from 468-CON (P = 0.003). C: Representative H&E section showing lymphovascular invasion (arrow) at the site of the primary tumor. Magnification: ×200 (main micrograph); ×400 (inset).
Figure 5
Figure 5
In vivo spontaneous metastasis of 468-CON, 468-OPN, and 468-ΔRGD cells. Cells were injected into the second thoracic mammary fat pad of female athymic nude (nu/nu) mice using 1 × 10⁶ cells/mouse and 20–26 mice/treatment group. At 12 weeks after injection, mice were either subjected to surgery to remove the primary tumor or sacrificed and assessed for metastatic burden. Mice in the surgery group were sacrificed 24 weeks after injection and assessed for metastatic burden. Tissue sections from regional and distant organs, including lymph nodes and lungs, were subjected to histochemical staining with H&E. The incidence of metastasis was determined in a blinded fashion by two independent pathologists. A: Spontaneous metastasis of 468-CON (white bars), 468-OPN (black bars), or 468-ΔRGD (hatched bars) cells at 12 weeks after injection (no surgery group; n = 10–16 mice/treatment group). B: Spontaneous metastasis of 468-CON (white bars), 468-OPN (black bars), or 468-ΔRGD (hatched bars) cells at 24 weeks after injection (surgery group; n = 10 mice/treatment group). * Significantly different from 468-CON (P = 0.024); δ significantly different from 468-ΔRGD (P = 0.038). C and D: Representative H&E sections showing lymph node micrometastases (C) or lung micrometastases (D). Magnification: ×100 (main micrographs); ×400 (inset).

References

    1. Jemal A, Murray T, Ward E, Samuels A, Tiwari RC, Ghafoor A, Feuer EJ, Thun MJ. Cancer statistics, 2005. CA Cancer J Clin. 2005;55:10–30. - PubMed
    1. Chambers AF, Groom AC, MacDonald IC. Dissemination and growth of cancer cells in metastatic sites. Nat Rev Cancer. 2002;2:563–572. - PubMed
    1. Pantel K, Brakenhoff RH. Dissecting the metastatic cascade. Nat Rev Cancer. 2004;4:448–456. - PubMed
    1. Fidler IJ. 7th Jan Waldenstrom Lecture. The biology of human cancer metastasis. Acta Oncol. 1991;30:668–675. - PubMed
    1. MacDonald IC, Groom AC, Chambers AF. Cancer spread and micrometastasis development: quantitative approaches for in vivo models. BioEssays. 2002;24:885–893. - PubMed

Publication types

MeSH terms