Comparative Study
. 2006 Nov;174(3):1529-38.
doi: 10.1534/genetics.106.060491. Epub 2006 Jul 2.

Nonlinear tests for genomewide association studies

Affiliations
Comparative Study

Nonlinear tests for genomewide association studies

Jinying Zhao et al. Genetics. 2006 Nov.

Abstract

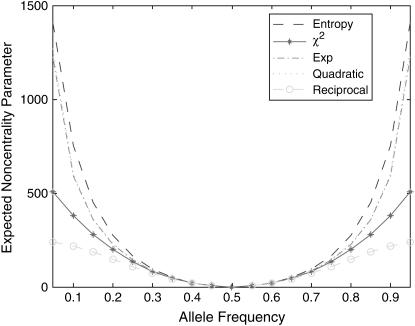
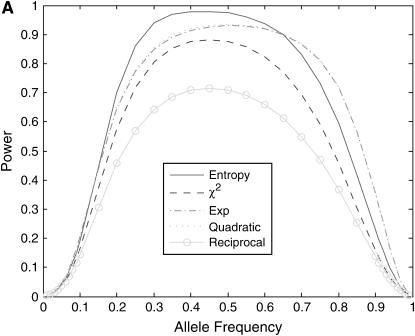
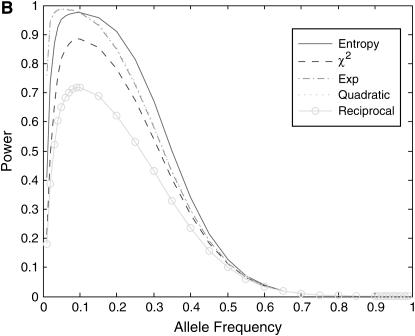
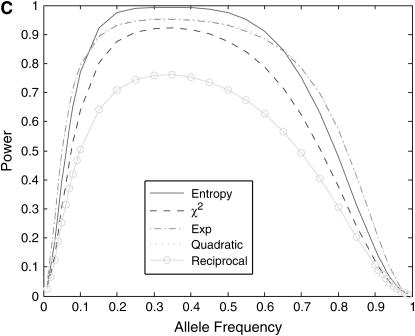
As millions of single-nucleotide polymorphisms (SNPs) have been identified and high-throughput genotyping technologies have been rapidly developed, large-scale genomewide association studies are soon within reach. However, since a genomewide association study involves a large number of SNPs it is therefore nearly impossible to ensure a genomewide significance level of 0.05 using the available statistics, although the multiple-test problems can be alleviated, but not sufficiently, by the use of tagging SNPs. One strategy to circumvent the multiple-test problem associated with genome-wide association tests is to develop novel test statistics with high power. In this report, we introduce several nonlinear tests, which are based on nonlinear transformation of allele or haplotype frequencies. We investigate the power of the nonlinear test statistics and demonstrate that under certain conditions, some nonlinear test statistics have much higher power than the standard chi2-test statistic. Type I error rates of the nonlinear tests are validated using simulation studies. We also show that a class of similarity measure-based test statistics is based on the quadratic function of allele or haplotype frequencies, and thus they belong to nonlinear tests. To evaluate their performance, the nonlinear test statistics are also applied to three real data sets. Our study shows that nonlinear test statistics have great potential in association studies of complex diseases.


Figures

F<sc>igure</sc> 1.—
Figure 1.—
Expected noncentrality parameters of the nonlinear test statistics and the standard formula image-test statistic as a function of the frequency of the disease allele in cases, assuming that the frequencies of two alleles at the disease locus in the controls are both equal to 0.5.
F<sc>igure</sc> 2.—
Figure 2.—
(A) Power of the nonlinear test statistics and the standard formula image-test statistic at the disease locus with a significance level of 0.001 for a disease model with penetrance formula image, and formula image as a function of the disease allele frequency, assuming equal sample size (n =100) in both cases and controls. (B) Power of the nonlinear test statistics and the standard formula image-test statistic at the disease locus with a significance level of 0.001 for a disease model with penetrance formula image, and formula image as a function of the disease allele frequency, assuming equal sample size (n = 100) in both cases and controls. (C) Power of the nonlinear test statistics and the standard formula image-test statistic at the disease locus with a significance level of 0.001 for a genotype relative risk disease model (r = 4) as a function of the disease allele frequency, assuming equal sample size (n = 100) in both cases and controls.

Similar articles

Cited by

References

    1. Ahmadi, K. R., M. E. Weale, Z. Y. Xue, N. Soranzo, D. P. Yarnall et al., 2005. A single-nucleotide polymorphism tagging set for human drug metabolism and transport. Nat. Genet. 37: 84–89. - PubMed
    1. Akey, J., L. Jin and M. Xiong, 2001. Haplotypes vs single marker linkage disequilibrium tests: What do we gain? Eur. J. Hum. Genet. 9: 291–300. - PubMed
    1. Altshuler, D., and A. G. Clark, 2005. Genetics. Harvesting medical information from the human family tree. Science 307: 1052–1053. - PubMed
    1. Bates, D. M., and D. G. Watts, 1980. Relative curvature measures of nonlinearity. J. R. Stat. Soc. Ser. B 42: 1–25.
    1. Borsting, C., J. J. Sanchez and N. Morling, 2005. SNP typing on the NanoChip electronic microarray. Methods Mol. Biol. 297: 155–168. - PubMed

Publication types