. 2006 Summer;11(2):135-47.
doi: 10.1379/csc-160r.1.

Stress-induced phosphorylation of caveolin-1 and p38, and down-regulation of EGFr and ERK by the dietary lectin jacalin in two human carcinoma cell lines

Affiliations

Stress-induced phosphorylation of caveolin-1 and p38, and down-regulation of EGFr and ERK by the dietary lectin jacalin in two human carcinoma cell lines

Anagh A Sahasrabuddhe et al. Cell Stress Chaperones. 2006 Summer.

Abstract

We have examined the A431 (human epidermoid carcinoma) and HT29 (human colorectal carcinoma) cellular responses evoked by lectins of dietary origin, Jacalin of Artocarpus integrifolia (native jacalin; nJacalin), peanut agglutinin (PNA) of Arachis hypogea, and recombinant single-chain jacalin (rJacalin), which has the same protein backbone but approximately 100-fold less affinity for carbohydrates than nJacalin. All three lectins (nJacalin, rJacalin, and PNA) are cycotoxic inhibitors of proliferation of A431 cells. However, cells recover once jacalin but not PNA have been removed from the growth medium. Treatment of nJacalin results in morphologically visible cell rounding while retaining the membrane integrity when treated at 40 microg ml(-1), but treatment with PNA did not induce such changes. The observed cell rounding was found to be due to stress as the phosphorylation of caveolin-1 (at tyr14), p38 but not c-Jun N-terminal kinase were up-regulated, while PNA did not up-regulate the phosphorylation of the same. Jacalin also down-regulated the phosphorylation of the epidermal growth factor receptor and extracellular signal regulated kinase in contrast to PNA, which failed to down-regulate the same. Confocal microscopic studies reveal that jacalin is not internalized, unlike the lectin of Agaricus bisporous. Analysis of the proteins that bind to an nJacalin-sepharose column revealed the binding of six to eight proteins, and significant among them is a protein at approximately 110 kDa, which appears to be oxygen-regulated protein 150 (ORP150) (endoplasmic reticulum chaperone) as identified by its isoelectric point, two-dimensional sodium dodecyl sulfate-polyacrylamide gel electrophoresis and mass spectrometric analysis. This 110-kDa band is detectable with anti-Hsp70 antibody because ORP150 has homology with Hsp70. Confocal microscopic studies reveal the presence of Hsp70-like proteins on the surface of A431 cells as revealed by immunostaining with anti-Hsp70 antibody. Moreover, overexpression of ORP150 in A431 cells has resulted in a dramatic protection of A431 cells against jacalin-induced toxicity, confirming that the jacalin-induced cytotoxicity is mediated through ORP150, and impairment of ORP150 functions with the help of jacalin makes the cells more susceptible to death due to stress. Our studies suggest that the cellular responses, as a consequence of lectin binding, may not be exclusively mediated by carbohydrate binding property alone, but other factors such as protein-protein interactions may also contribute to the observed cellular responses.


Figures

Fig. 1.
Fig. 1.
Treatment of A431 and HT29 with indicated lectins. The MTT assay was performed as described in Materials and Methods. HT29 cells (A and C) or A431 cells (B and D) were incubated in the presence of various concentrations of nJacalin, rJacalin, or PNA for 24 h, and viable cells were estimated by MTT. In all panels, cells without any treatment were considered as 100% viable and viable cells (mean ± SD, n = 5) were expressed as a fraction of untreated cells. Data represent the average of three parallel wells and one of the five independent experiments. Recovery of HT29 (C) and A431 (D) cells after lectin treatment: HT29 or A431 cells were treated with 25 μg ml−1 for 24 h and the lectin was removed from the medium, fresh medium containing 10% FBS was added to wells for 24 h, and the MTT assay was carried out as described in the text. Groups labeled “Lectin treatment” and “Recovery” represent lectin treatment and recovery after lectin treatment, respectively. The results shown are an average of three independent measurements and the error bar represent standard deviations (n = 5).
Fig. 2.
Fig. 2.
Cell trypan blue staining and morphological changes. (A) Trypan blue staining was carried out on lectin-treated A431 or HT29 cells as described in Materials and Methods. A431 cells (A) and HT29 cells (B) were incubated in the presence or absence of nJacalin, rJacalin, or PNA for 2 h and 4 h, and viable cells were counted after staining with trypan blue dye. In all panels, the percentage of viable cells was estimated from the cells without any treatment and viable cells after lectin treatment (mean ± SD, n = 5) is expressed as a percentage of untreated cells. The results shown are an average of three independent measurements and the error bar represent standard deviations (n = 5). (C) Morphology of A431 cells after lectin treatment (50 μg ml−1) was observed as described in the Materials and Methods section. The morphological changes shown are one representative set of observations of six independent measurements.
Fig. 3.
Fig. 3.
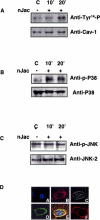
Phosphorylation of caveolin-1, p38, and JNK. Kinetics of phosphorylation of caveolin-1, p38, and JNK by nJacalin treatment was carried out as described in Materials and Methods, and probed with indicated antibodies. (A) Time-dependant phosphorylation of caveolin-1 after treatment of nJacalin (50 μg ml−1). The top and bottom panels were obtained by probing with anti-phospho-tyr14-specific and anticaveolin-1 antibodies, respectively. (B) Time-dependant phosphorylation of p38 after treatment of nJacalin (50 μg ml−1). The top and bottom panels were obtained by probing with antiphospho-specific p38 and anti-p38-specific antibodies, respectively. (C) Stress-induced phosphorylation of JNK after treatment of nJacalin (50 μg ml−1). All panels are one of the representative set out of three independent experiments. (D) Immunofluorescence studies of localization of phosphocaveolin-1, caveolin-1, and jacalin. (A) Nuclear staining with DAPI, (B) surface staining of Tyr14 phospho Caveolin-1, (C) phase-contrast image, (D) surface staining of jacalin-FITC, (E) merged image of FITC-nJacalin and phosphocaveolin-1 along with nuclear staining, (F) surface staining of caveolin-1.
Fig. 4.
Fig. 4.
Immunofluorescence studies of jacalin on A431 cells. (A) A-431 cells were grown on coverslips and treated with FITC-labeled nJacalin (100 nM) and DAPI (1 μg ml−1) for nuclear staining. (A) Nuclear staining with DAPI. (B) Cell surface localization of FITC-labeled nJacalin. (C) Dual staining of nJacalin and DAPI. (D) Phase-contrast image. (B) Dual staining of nJacalin and EGFr. A-431 cells are treated with FITC-nJacalin (100 nM) followed by staining for EGFr-specific antibody and DAPI (1 μg ml−1). (A) Nuclear staining with DAPI, (B) cell surface staining of FITC-nJacalin, (C) cell surface staining of EGFr, (D) merged image of FITC-nJacalin and EGFr along with nuclear staining.
Fig. 5.
Fig. 5.
Down-regulation of EGFr and ERK signaling by nJacalin. Down-regulation of phosphorylation on EGFr and ERK was monitored after treatment of jacalin and peanut lectins as described in Materials and Methods. (A) Concentration Kinetics of phosphorylation on EGFr after the indicated concentration of jacalin treatment followed by stimulation with TGFα (20 ng/reaction). In all panels lanes designated with a U and an S indicate unstimulated cells and cells stimulated with TGFα (20 ng/reaction), respectively. The top and bottom panels were obtained by probing with antiphosphotyrosine and anti-EGFr, respectively. (B) Time kinetics of phosphorylation of EGFr was carried out as described above: cells stimulated with a 40 μg ml−1 concentration of nJacalin for 5, 10, 15, 20, 25, and 30 min followed by stimulation with TGFα (20 ng). The top and bottom panels were obtained by probing with antiphosphotyrosine and anti-EGFr, respectively. (C) Concentration kinetics of phosphorylation of EGFr after treatment with rJacalin at various concentrations as mentioned. Cells were treated with rJacalin at 5, 10, 20, 40, and 80 μg ml−1 followed by stimulation with TGFα (20 ng). (D) Time kinetics of phosphorylation on EGFr after treatment of rJacalin as described above. Cells stimulated with 40 μg ml−1 rJacalin for 15 and 30 min followed by TGFα stimulation. (E) Phosphorylation status of EGFr of A431 cells after jacalin or peanut lectin treatment. Cells were treated with 40 μg ml−1 nJacalin or peanut agglutinin for 30 min followed by stimulation with TGFα (20 ng) as described in Materials and Methods. (F) Phosphorylation status of ERK of A431 cells after lectin treatment was carried out as described above for EGFr. Cells stimulated with nJacalin or PNA for 30 min followed by stimulation with TGFα. (G) Phosphorylation status of ERK of A431 cells after rJacalin treatment by following the same procedure as that in (F). In all panels, top panels were obtained by probing with antiphosphotyrosine and bottom panels with the indicated antibodies.
Fig. 6.
Fig. 6.
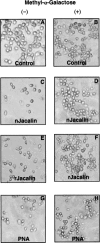
Inhibition of homotypic aggregation of A431 cells by jacalin. A homotypic aggregation inhibition assay was performed as described in Materials and Methods. A431 cells were incubated in the presence or absence of nJacalin, rJacalin, and PNA, and in the presence or absence of their selective sugar methyl-α-galactose at a 50 mM concentration for 1 h. Cell aggregation inhibition as well as aggregation after sugar addition to the reaction along with lectin were observed and captured directly from phase-contrast microscopy. (A, C, E, and G) represent photos of control cells without any treatment of lectin, nJacalin, rJacalin, and PNA, respectively. (B, D, F, and H) represent photos of cells in the presence of a 50 mM concentration of methyl-α-galactose (ie, control cells without treatment of lectin, nJacalin, rJacalin, and PNA, respectively). The results shown are an average of three independent measurements.
Fig. 7.
Fig. 7.
1-D and 2-D gel analysis of jacalin-bound proteins of A431 cells. A-431 cell lysate were run on an NHS sepharose coupled with native jacalin matrix and purified with 50 mM Me α Gal. The fractions thus purified were run on 1-D and 2-D SDS-PAGE. (A) Lane 1: Intracellular jacalin binding profile of A431 cell lysate after jacalin-NHS sepharose affinity purification. Lane 2: Intracellular PNA binding profile of A431 cell lysate after PNA-NHS sepharose affinity purification. Lane 3: Ligand blotting of elute from A431 cell lysate after jacalin-NHS sepharose affinity purification. Lane 4: Probing of elute from A431 cell lysate after jacalin-NHS affinity purification with anti-HSP70 antibody. (B) 2-D electrophoresis profile of A431 cell lysate after jacalin-NHS sepharose affinity purification. Black arrows indicate protein spots obtained. Horizontal axis shows isoelectric point and vertical axis shows molecular weight in kilodaltons.
Fig. 8.
Fig. 8.
(A) Immunofluorescence studies. A-431 cells were grown on coverslips and probed with anti-HSP70 antibody without permeabilization. (A) Phase-contrast image of negative control without anti-HSP70 antibody. (B) Immunostaining with only secondary anti-goat-TRITC labeled antibody. (C) Phase-contrast image of cell probed with anti-HSP70 antibody and respective anti-goat-TRITC labeled antibody. (D) Cell surface staining of anti-HSP70 and respective secondary TRITC-labeled antibody. (B) MTT assay with A431-ORP150 cells. MTT assay was performed as described in Materials and Methods. A431 and A431-ORP150 cells were incubated in the presence of various concentrations of nJacalin for 24 h, and viable cells were estimated by MTT. In all panels, cells without any treatment were considered as 100% viable and viable cells (mean ± SD, n = 5) are expressed as a fraction of untreated cells. Data represent the average of three parallel wells and one of the five independent experiments.

Similar articles

Cited by

References

    1. Agrawal BB, Goldstein IJ. Physical and chemical characterization of concanavalin A, the hemagglutinin from jack bean (Canavalia ensiformis) Biochim Biophys Acta. 1967;133:376–379.0006-3002(1967)133[0376:PACCOC]2.0.CO;2 - PubMed
    1. Batterbury M, Tebbs CA, Rhodes JM, Grierson I. Agaricus bisporus (edible mushroom lectin) inhibits ocular fibroblast proliferation and collagen lattice contraction. Exp Eye Res. 2002;74:361–370.0014-4835(2002)074[0361:ABEMLI]2.0.CO;2 - PubMed
    1. Blasco E, Barra A, Nicolas M, Lecron JC, Wijdenes J, Preud'homme JL. Proliferative response of human CD4+ T lymphocytes stimulated by the lectin jacalin. Eur J Immunol. 1995;25:2010–2018.0014-2980(1995)025[2010:PROHCT]2.0.CO;2 - PubMed
    1. Brady PG, Vannier AM, Banwell JG. Identification of the dietary lectin, wheat germ agglutinin, in human intestinal contents. Gastroenterology. 1978;75:236–239.0016-5085(1978)075[0236:IOTDLW]2.0.CO;2 - PubMed
    1. Calvert ME, Digilio LC, Herr JC, Coonrod SA. Oolemmal proteomics—identification of highly abundant heat shock proteins and molecular chaperones in the mature mouse egg and their localization on the plasma membrane. Reprod Biol Endocrinol. 2003;1:27.1477-7827(2003)001[0027:OPOHAH]2.0.CO;2 - PMC - PubMed

Publication types

MeSH terms

LinkOut - more resources