

PROMPT: a protein mapping and comparison tool
- PMID: 16817977
- PMCID: PMC1569443
- DOI: 10.1186/1471-2105-7-331
PROMPT: a protein mapping and comparison tool
Abstract
Background: Comparison of large protein datasets has become a standard task in bioinformatics. Typically researchers wish to know whether one group of proteins is significantly enriched in certain annotation attributes or sequence properties compared to another group, and whether this enrichment is statistically significant. In order to conduct such comparisons it is often required to integrate molecular sequence data and experimental information from disparate incompatible sources. While many specialized programs exist for comparisons of this kind in individual problem domains, such as expression data analysis, no generic software solution capable of addressing a wide spectrum of routine tasks in comparative proteomics is currently available.
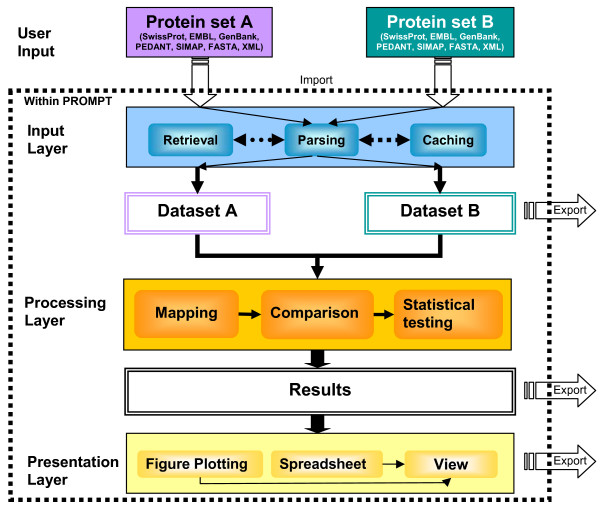
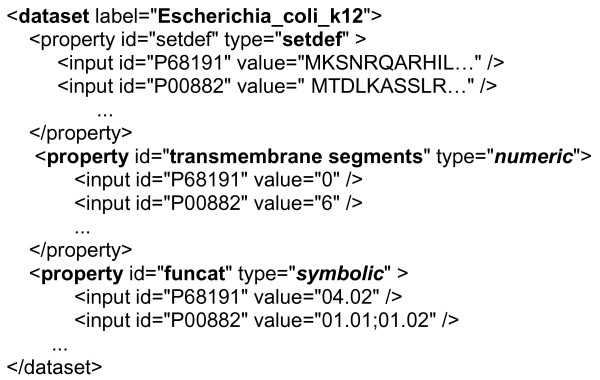
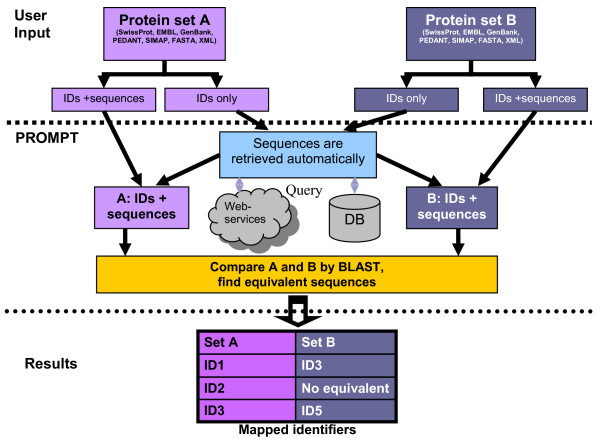
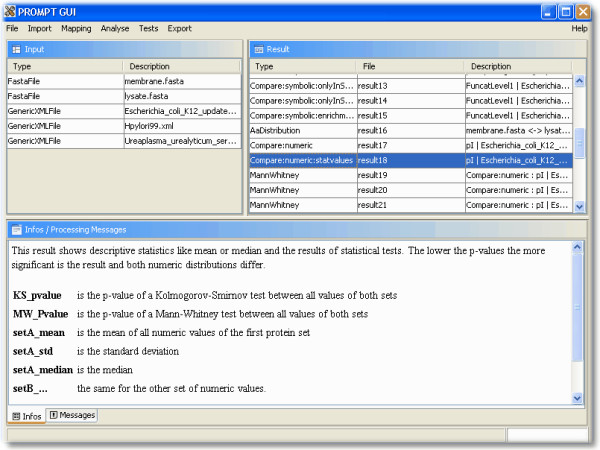
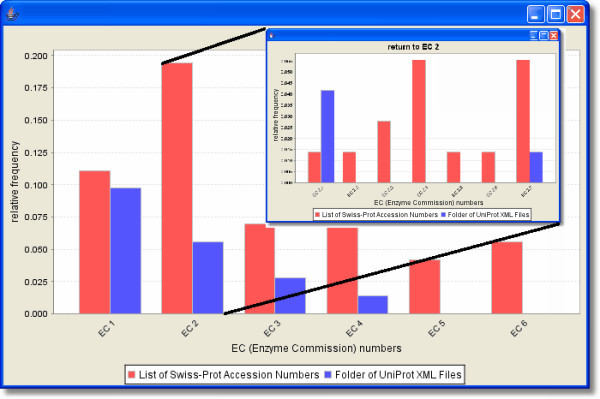
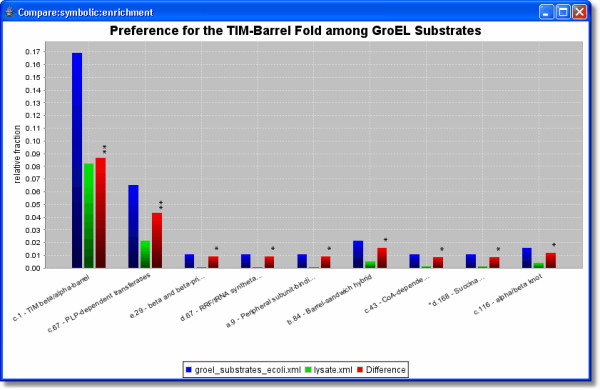
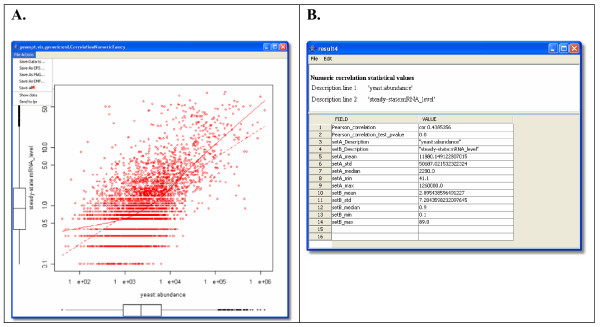
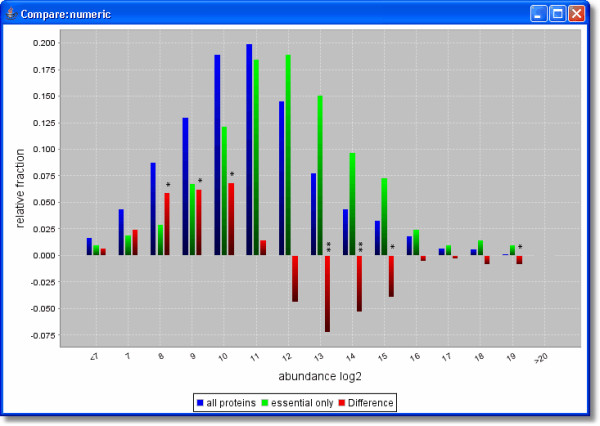
Results: PROMPT is a comprehensive bioinformatics software environment which enables the user to compare arbitrary protein sequence sets, revealing statistically significant differences in their annotation features. It allows automatic retrieval and integration of data from a multitude of molecular biological databases as well as from a custom XML format. Similarity-based mapping of sequence IDs makes it possible to link experimental information obtained from different sources despite discrepancies in gene identifiers and minor sequence variation. PROMPT provides a full set of statistical procedures to address the following four use cases: i) comparison of the frequencies of categorical annotations between two sets, ii) enrichment of nominal features in one set with respect to another one, iii) comparison of numeric distributions, and iv) correlation of numeric variables. Analysis results can be visualized in the form of plots and spreadsheets and exported in various formats, including Microsoft Excel.
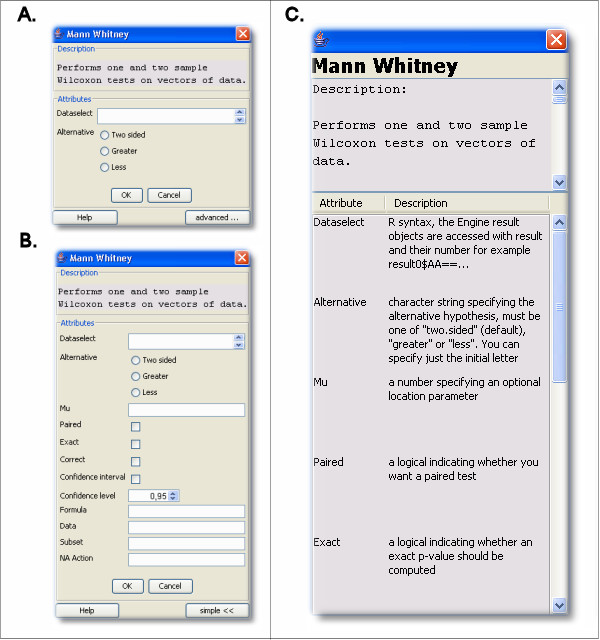
Conclusion: PROMPT is a versatile, platform-independent, easily expandable, stand-alone application designed to be a practical workhorse in analysing and mining protein sequences and associated annotation. The availability of the Java Application Programming Interface and scripting capabilities on one hand, and the intuitive Graphical User Interface with context-sensitive help system on the other, make it equally accessible to professional bioinformaticians and biologically-oriented users. PROMPT is freely available for academic users from http://webclu.bio.wzw.tum.de/prompt/.
Figures
Similar articles
-
GeneTools--application for functional annotation and statistical hypothesis testing.BMC Bioinformatics. 2006 Oct 24;7:470. doi: 10.1186/1471-2105-7-470. BMC Bioinformatics. 2006. PMID: 17062145 Free PMC article.
-
MILANO--custom annotation of microarray results using automatic literature searches.BMC Bioinformatics. 2005 Jan 20;6:12. doi: 10.1186/1471-2105-6-12. BMC Bioinformatics. 2005. PMID: 15661078 Free PMC article.
-
Windows .NET Network Distributed Basic Local Alignment Search Toolkit (W.ND-BLAST).BMC Bioinformatics. 2005 Apr 8;6:93. doi: 10.1186/1471-2105-6-93. BMC Bioinformatics. 2005. PMID: 15819992 Free PMC article.
-
The apoptosis database.Cell Death Differ. 2003 Jun;10(6):621-33. doi: 10.1038/sj.cdd.4401230. Cell Death Differ. 2003. PMID: 12761571 Review.
-
A bioinformatics perspective on proteomics: data storage, analysis, and integration.Biosci Rep. 2005 Feb-Apr;25(1-2):95-106. doi: 10.1007/s10540-005-2850-4. Biosci Rep. 2005. PMID: 16222422 Review.
Cited by
-
Protein abundance profiling of the Escherichia coli cytosol.BMC Genomics. 2008 Feb 27;9:102. doi: 10.1186/1471-2164-9-102. BMC Genomics. 2008. PMID: 18304323 Free PMC article.
-
The Protein Identifier Cross-Referencing (PICR) service: reconciling protein identifiers across multiple source databases.BMC Bioinformatics. 2007 Oct 18;8:401. doi: 10.1186/1471-2105-8-401. BMC Bioinformatics. 2007. PMID: 17945017 Free PMC article.
-
PEDANT genome database: 10 years online.Nucleic Acids Res. 2007 Jan;35(Database issue):D354-7. doi: 10.1093/nar/gkl1005. Epub 2006 Dec 5. Nucleic Acids Res. 2007. PMID: 17148486 Free PMC article.
-
The fungus Ustilago maydis and humans share disease-related proteins that are not found in Saccharomyces cerevisiae.BMC Genomics. 2007 Dec 20;8:473. doi: 10.1186/1471-2164-8-473. BMC Genomics. 2007. PMID: 18096044 Free PMC article.
-
Assignment of isochores for all completely sequenced vertebrate genomes using a consensus.Genome Biol. 2008;9(6):R104. doi: 10.1186/gb-2008-9-6-r104. Epub 2008 Jun 30. Genome Biol. 2008. PMID: 18590563 Free PMC article.
References
Publication types
MeSH terms
LinkOut - more resources
Full Text Sources
