. 2006 Jul 1;20(13):1817-28.
doi: 10.1101/gad.375706.

The RhoGAP crossveinless-c links trachealess and EGFR signaling to cell shape remodeling in Drosophila tracheal invagination

Affiliations

The RhoGAP crossveinless-c links trachealess and EGFR signaling to cell shape remodeling in Drosophila tracheal invagination

Véronique Brodu et al. Genes Dev. .

Abstract

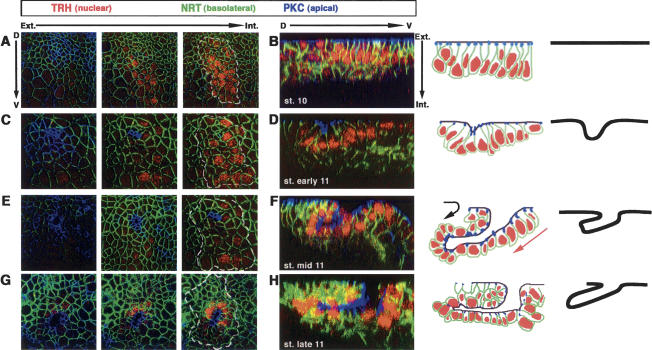
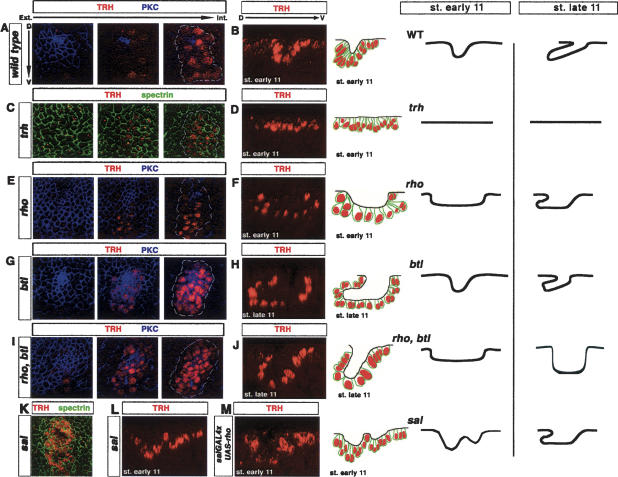
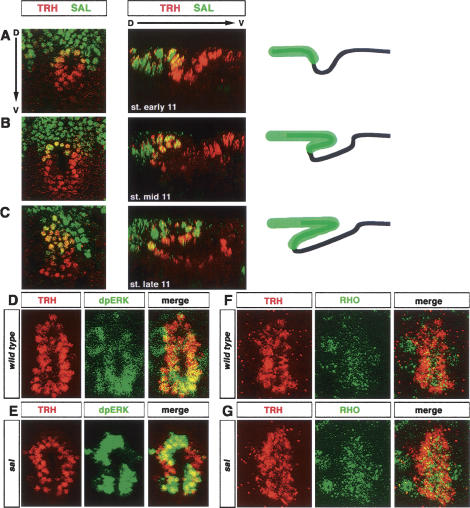
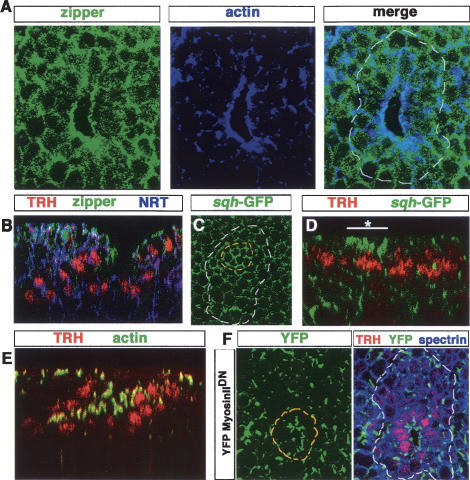
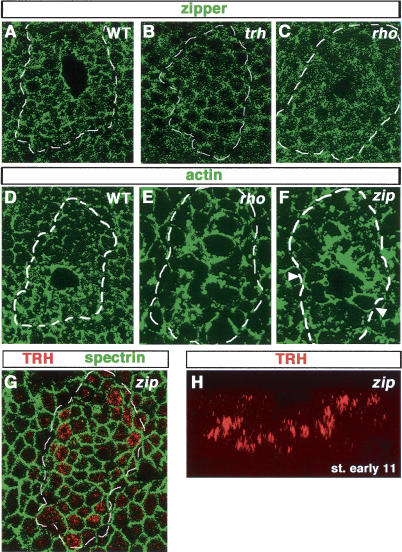
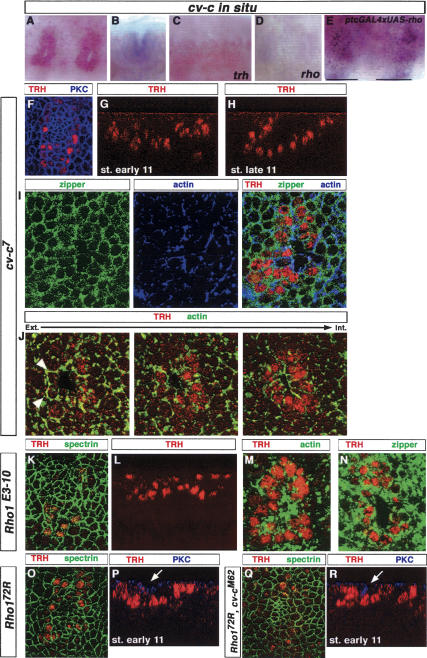
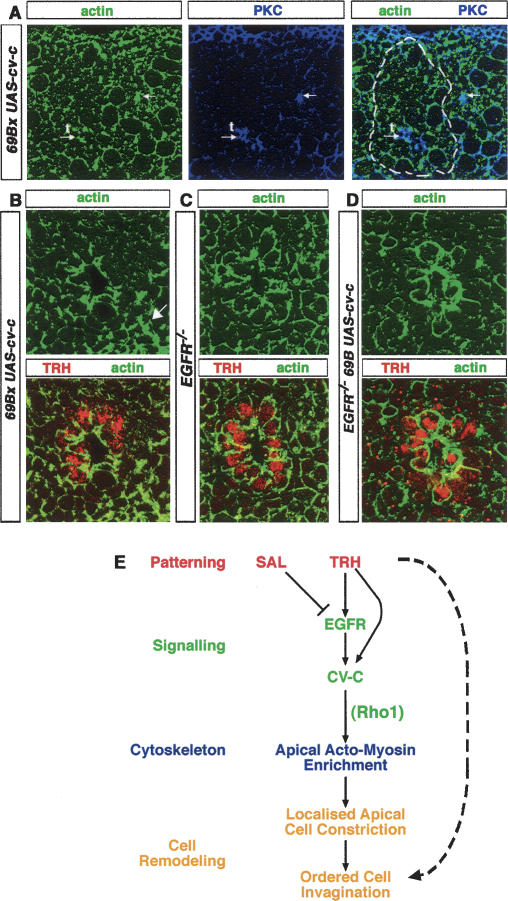
A major issue in morphogenesis is to understand how the activity of genes specifying cell fate affects cytoskeletal components that modify cell shape and induce cell movements. Here, we approach this question by investigating how a group of cells from an epithelial sheet initiate invagination to ultimately form the Drosophila tracheal tubes. We describe tracheal cell behavior at invagination and show that it is associated with, and requires, a distinct recruitment of Myosin II to the apical surface of cells at the invaginating edge. We show that this process is achieved by the activity of crossveinless-c, a gene coding for a RhoGAP and whose specific transcriptional activation in the tracheal cells is triggered by both the trachealess patterning gene and the EGF Receptor (EGFR) signaling pathway. Our results identify a developmental pathway linking cell fate genes and cell signaling pathways to intracellular modifications during tracheal cell invagination.


Figures

Figure 1.
Figure 1.
Wild-type sequences of cell shape changes during tracheal invagination. Invagination of a tracheal placode is observed either using consecutive sections from the surface of the epithelium into the placode (A,C,E,G) or a single perpendicular section through the middle of the placode together with schematic representations (B,D,F,H). Here and in subsequent figures, anterior is to the left and dorsal to the top for the consecutive sections. For the perpendicular sections, dorsal is to the left and external to the top. The position of the tracheal placode is marked with a white dashed line. Tracheal cells are labeled using an anti-trachealess antibody (TRH). Anti-Neurotactin (NRT) labels the basolateral and basal sides of all epithelial cells, while PKC labels their apical side. In the schematic diagrams, the dark line delineates the apical surfaces of the cells. (A,B) At stage 10 before invagination, cells form a flat epithelium. (C,D) At the onset of invagination at early stage 11, a small group of cells has reduced its apical perimeter, and the epithelium begins to bend. Note that the most apical region of those cells lies in a deeper position than the neighboring ones. (EH) As invagination proceeds during mid- and late stage 11, the apical surface of the invaginating cells is found in an even deeper position. Cells of the dorsal side of the placode have rotated completely around their axis and are found inside the embryo (black arrow), while ventral cells gradually slide beneath (red arrow), both movements leading to the formation of a finger-like structure.
Figure 2.
Figure 2.
Genetic control of cell shape changes during tracheal invagination. Consecutive confocal sections (A,C,E,G,I) and single perpendicular sections with schematic representation of the apical position of cells at early (B,D,F,L,M) and late (H,J) stage 11 in different mutant backgrounds. Here and in Figure 5, anti-α spectrin is used to label all epithelial cell membranes. (A,B) In wild-type embryos, invagination is initiated with the apical constriction of a small, spatially restricted, group of cells and curving of the epithelial layer. (C,D) In trh mutants, no sign of apical constriction is detected, and the epithelium remains flat. (E,F) In rho mutants, initiation of apical constriction within a few cells is not observed. Instead, aberrant invagination leads to the formation of a large cavity in the tracheal placode. By the end of stage 11, an abnormal finger-like structure is observed. (G,H) btl (FGFR) mutants exhibit localized apical constriction and finger-like formation at the onset of invagination. Nevertheless, the finger does not extend further during stage 11. (I,J) Initiation of invagination in rho, btl placodes is as in rho mutants. However, at late stage 11, a finger-like structure is never observed. (K,L) In sal mutants, invagination is initiated at two positions and ultimately gives rise to an abnormal finger-like structure at late stage 11. (M) Similarly, overexpression of rhomboid driven by salGAL4 in the dorsal half of the placode (see Fig. 3) leads to formation of a double arch at the early stage 11 placode.
Figure 3.
Figure 3.
sal down-regulates EGFR activity in the dorsal tracheal cells. (AC) The tracheal placode is divided into a dorsal, spalt (SAL)-positive domain, and a ventral, SAL-negative one. (A) The invagination point is located at the border between these two domains. (B,C) SAL-positive cells contribute to the formation of the roof of the extending finger. In the schematic diagram, black lines represent the apical surfaces of the tracheal cells, while green represents the domain of SAL expression. (D,E) dpERK is detected at higher levels in the ventral half of the wild-type placode, while the opposite is observed in sal mutants. (F,G) Rhomboid accumulation is higher on the ventral side of wild-type placodes (mean signal amplitude of the ventral side of 93.76 [SD 18.14]; cf. 58.65 [SD 16.69] of the dorsal side). In contrast, Rhomboid is more evenly distributed in sal mutants (mean signal amplitude of the ventral side of 122.17 [SD 24.96]; cf. 115.80 [SD 34.04] of the dorsal side).
Figure 4.
Figure 4.
Actin and myosin II distribution in tracheal cells. (A) Myosin II, as detected with an anti-zipper antibody, is specifically localized at the site of invagination. (B) Myosin II and actin colocalize at the invagination point. (C) Restricted distribution of zipper is seen in a perpendicular section. (D) Accumulation of Myosin II is detected at the onset of invagination in the cells initiating apical constriction (white line with an asterisk), as visualized by a GFP-tagged form of Myosin II light chain (sqh-GFP). (E) In contrast to the restricted zipper distribution, actin is strongly enriched apically in all tracheal cells during invagination. (F) A non-actin-binding YFP-Myosin IIDN accumulates irregularly at the invagination cells (outlined in yellow) forming noncontinuous apical patches. This mutated version of Myosin II construct is expressed using the GAL4 driver 69B, and its distribution is followed using an anti-GFP antibody.
Figure 5.
Figure 5.
Myosin II accumulation during invagination depends on trh and EGFR signaling. (A) Using sqh-GFP, apical enrichment of Myosin II is detected in a small group of cells in the center of the placode prior to invagination. Note that sqh-GFP within this group of cells (outlined in yellow) is stronger and more continuous than in surrounding cells. (B) No Myosin II enrichment is detected in trh placodes visualized using anti-zipper. Note that the levels are similar inside and outside of the placode, and with the nontracheal cells of a wild-type embryo (as shown in A). Myosin II (C) and apical actin (E) enrichment are strongly affected in rho placodes (cf. with wild type in Fig. 4B). Wild-type (D) and zip (F) tracheal placodes. In contrast to the distinct apical enrichment of actin seen in wild type (D), in a zip tracheal placode, actin is evenly distributed along the entire cell surface (e.g., see arrowheads in F). (G,H) In zip mutants, the small group of cells that initiates apical constriction is not observed, and tracheal cells form a large cavity during invagination.
Figure 6.
Figure 6.
The RhoGAP encoded by cv-c is a mediator of trh- and EGFR-induced invagination and interacts genetically with the small Rho-GTPase Rho1. (AE) Expression of cv-c mRNA in wild-type (A,B), trh (C), and rho (D) placodes. At stage 11, cv-c expression is restricted to the tracheal cells (A) and seems enriched apically (B). No expression is detected in trh mutants, while a low level remains in rho mutants. (E) Overexpression of rhomboid driven in stripes by ptcGAL4 leads to ectopic cv-c expression. Black lines correspond to the limits of the ptcGAL4 expression domain. (FH) In cv-c placodes, the small group of cells initiating apical constriction is not detected. At early stage 11, formation of a large cavity in the tracheal placode is observed, and by the end of stage 11, a disorganized finger-like structure is observed. (I,J) In cv-c mutants, actin and zipper colocalize in patches. In addition, actin is now detected along the basolateral and basal sides (e.g., see arrowheads in J). (KN) In Rho1-null mutants, initiation of apical constriction within a few cells is not observed (K). (L) Instead, aberrant invagination leads to the formation of a large cavity in the tracheal placode. In addition, actin (M) and myosin (N) distributions are strongly affected. (O,P) In a Rho172R hypomorphic mutant background, localized apical constriction is not detected (O), and invagination proceeds, forming a large cavity (P). (Q,R) In double homozygous Rho172R; cvcM62 mutant placodes, initiation of apical constriction and finger-like formation are rescued at the onset of invagination. Compare the degree of apical cell constriction using PKC marker between single Rho172R mutant (P) and double mutant (R) (white arrows).
Figure 7.
Figure 7.
cv-c controls actin distribution. (A) cv-c overexpression driven by 69B directs ectopic invagination of small patches of cells (white arrows) outside the tracheal placode (white arrow with t). The apical cell membranes, visualized by PKC, are detected in more internal sections and colocalize with higher actin levels. (B) Overexpression of cv-c using a 69B driver leads to large actin enrichment in many ectodermal cells, mostly apically (i.e., those marked with an arrow). (C) In an Egfr mutant placode, apical actin accumulation is severely disrupted. (D) In contrast, overexpression of cv-c in this mutant background partially rescues apical actin enrichment. (E) Model for ordered tracheal cell invagination (see text for details).

Similar articles

Cited by

References

    1. Barrio R., de Celis J.F., Bolshakov S., Kafatos F.C. Identification of regulatory regions driving the expression of the Drosophila spalt complex at different developmental stages. Dev. Biol. 1999;215:33–47. - PubMed
    1. Bernards A. GAPs galore! A survey of putative Ras superfamily GTPase activating proteins in man and Drosophila. Biochim. Biophys. Acta. 2003;1603:47–82. - PubMed
    1. Bloor J.W., Kiehart D.P. zipper Nonmuscle myosin-II functions downstream of PS2 integrin in Drosophila myogenesis and is necessary for myofibril formation. Dev. Biol. 2001;239:215–228. - PubMed
    1. Boube M., Llimargas M., Casanova J. Cross-regulatory interactions among tracheal genes support a co-operative model for the induction of tracheal fates in the Drosophila embryo. Mech. Dev. 2000;91:271–278. - PubMed
    1. Boube M., Martin-Bermudo M.D., Brown N.H., Casanova J. Specific tracheal migration is mediated by complementary expression of cell surface proteins. Genes & Dev. 2001;15:1554–1562. - PMC - PubMed

Publication types