Comparative Study
. 2006 Jul 10;203(7):1693-700.
doi: 10.1084/jem.20060468. Epub 2006 Jul 3.

Expression of interleukin (IL)-2 and IL-7 receptors discriminates between human regulatory and activated T cells

Affiliations
Comparative Study

Expression of interleukin (IL)-2 and IL-7 receptors discriminates between human regulatory and activated T cells

Nabila Seddiki et al. J Exp Med. .

Abstract

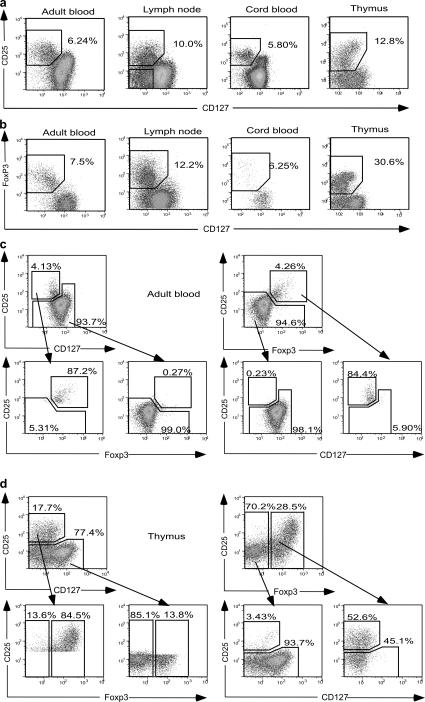
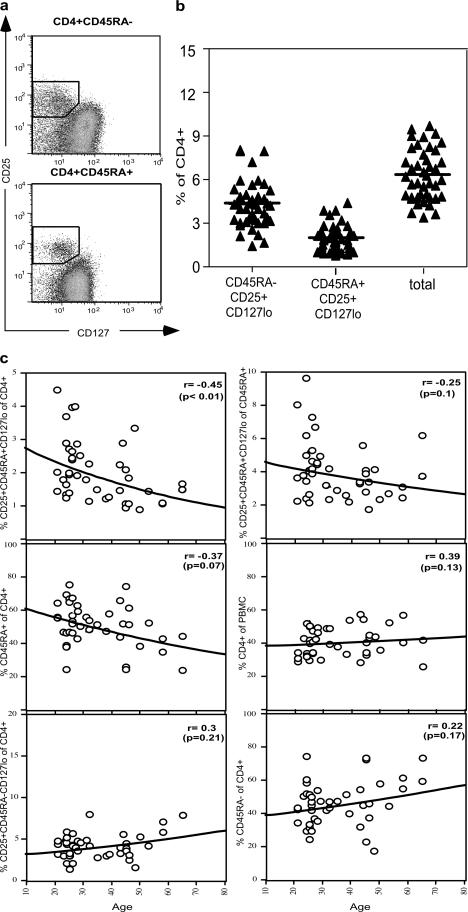
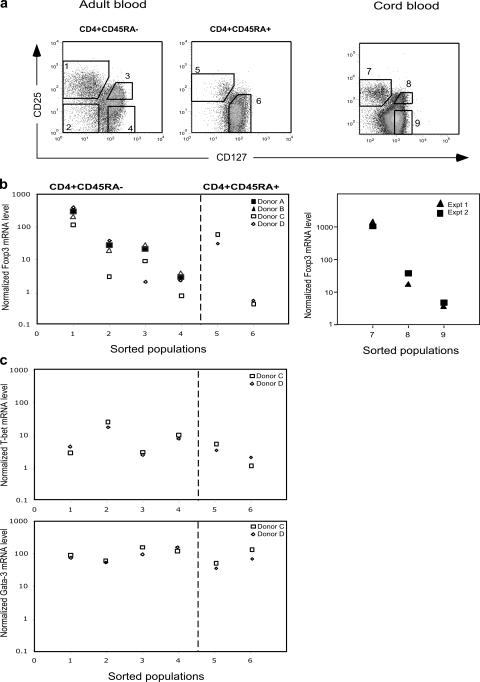
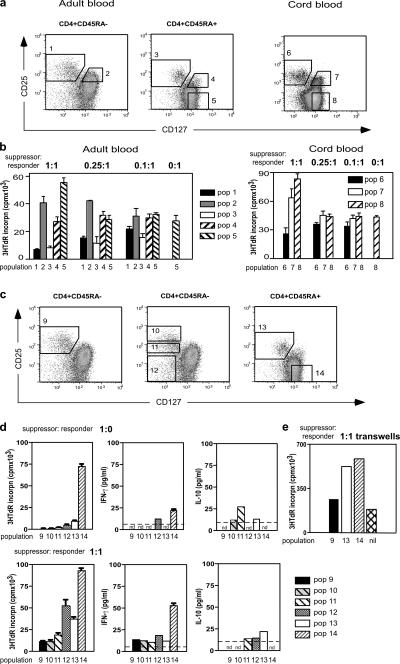
Abnormalities in CD4(+)CD25(+)Foxp3(+) regulatory T (T reg) cells have been implicated in susceptibility to allergic, autoimmune, and immunoinflammatory conditions. However, phenotypic and functional assessment of human T reg cells has been hampered by difficulty in distinguishing between CD25-expressing activated and regulatory T cells. Here, we show that expression of CD127, the alpha chain of the interleukin-7 receptor, allows an unambiguous flow cytometry-based distinction to be made between CD127(lo) T reg cells and CD127(hi) conventional T cells within the CD25(+)CD45RO(+)RA(-) effector/memory and CD45RA(+)RO(-) naive compartments in peripheral blood and lymph node. In healthy volunteers, peripheral blood CD25(+)CD127(lo) cells comprised 6.35 +/- 0.26% of CD4(+) T cells, of which 2.05 +/- 0.14% expressed the naive subset marker CD45RA. Expression of FoxP3 protein and the CD127(lo) phenotype were highly correlated within the CD4(+)CD25(+) population. Moreover, both effector/memory and naive CD25(+)CD127(lo) cells manifested suppressive activity in vitro, whereas CD25(+)CD127(hi) cells did not. Cell surface expression of CD127 therefore allows accurate estimation of T reg cell numbers and isolation of pure populations for in vitro studies and should contribute to our understanding of regulatory abnormalities in immunopathic diseases.


Figures

Figure 1.
Figure 1.
Expression of CD127 and FoxP3 in adult blood, lymph node, cord blood, and thymus. (a) Plots are gated for CD4+CD8 T cells. CD25+CD127lo cells are boxed and the percentage of cells in the box is shown. In the lymph node sample, CD25CD127lo cells are also boxed. (b) Plots are gated for CD4+CD8 T cells. FoxP3+CD127lo cells are boxed and the percentage of cells in the box is shown. (c) Correlation between FoxP3+CD25+ and CD25+CD127lo phenotypes in peripheral blood. Gating of CD4+ cells for each subset is shown, followed by the distribution of gated cells according to the reciprocal subset. (d) Correlation between FoxP3+ and CD25+CD127lo phenotypes in thymus.
Figure 2.
Figure 2.
Correlation between expression of FoxP3 and CD127lo phenotype. (a) Leukocytes from adult blood, lymph node, and cord blood were gated into CD3+CD4+CD45RA+ and CD45RA populations. FoxP3+ cells are boxed and the percentage of cells in the box is shown, together with expression of CD25 versus CD127 within the FoxP3+ gate. (b) Correlation between the percentages of CD25+CD127lo and CD25+FoxP3+ cells within CD4+CD45RA+ and CD45RA populations in nine peripheral blood samples from healthy volunteers.
Figure 3.
Figure 3.
Percentages of CD4+CD25+CD127lo cells in peripheral blood from 43 healthy volunteers. (a) Gating strategy for CD4+ cells subdivided into CD45RA and CD45RA+ subpopulations. Boxes indicate the placement of the analysis gates for each cell population. (b) CD45RA and CD45RA+CD25+CD127lo cells, expressed as a percentage of total CD4+ T cells. Total T reg cell percentages were derived by adding together the values for CD45RA and CD45RA+ T reg cell subsets. Horizontal bars represent the group means. (c) Relationship between various CD4+ T cell subpopulations and age.
Figure 4.
Figure 4.
Quantitative analysis of Foxp3 mRNA expression in sorted populations of CD4+ T cells. (a) Sorting strategy for isolation of subsets of CD4+ T cells from adult and cord blood. Dot plots are gated for lymphocytes expressing CD4, together with CD45RA in the case of adult blood. Numbered boxes indicate the placement of the flow sorting gates for each cell population. (b) RT qPCR for Foxp3 was performed in duplicate using RNA prepared from sorted cell populations. Sorted CD45RA cells from four donors were compared, whereas sufficient CD45RA+ cells were available from only two donors. (c) RT qPCR for T-bet and GATA3 using RNA prepared from sorted cell populations from two adult donors.
Figure 5.
Figure 5.
Suppression of in vitro proliferation by T reg cells from adult and cord blood. (a) Sorting strategy for isolation of subsets of CD4+ T cells. Dot plots are gated for lymphocytes expressing CD4, together with CD45RA in the case of adult blood. Numbered boxes indicate the placement of the flow sorting gates for each cell population. (b) Suppression by flow sorted populations (nos. –5) from adult blood and populations (nos. –8) from cord blood. Responder cells were sorted autologous CD4+CD45RA+CD25 cells (population 5) for adult blood and autologous CD4+CD25 cells (population 8) for cord blood. Ratios of suppressor to responder cells are shown above the figure. Bars represent the mean ± SEM of three to four replicate cultures. Assays of adult blood are representative of two independent experiments and the cord blood data are derived from a single experiment. (c) Strategy for isolation of subsets of CD4+CD127lo T cells from adult blood, sorted on the basis of CD25 expression. (d) Suppression and cytokine production by flow sorted populations (nos. –14) from adult blood. Responder cells were sorted autologous CD4+CD45RA+CD25 cells (population 14). Limit of detection in the cytokine assays is indicated by the dotted line. nd, not detected. (f) Transwell cultures of flow sorted populations (nos. , –, and nil) at a 1:1 ratio.

References

    1. Sakaguchi, S. 2004. Naturally arising CD4+ regulatory T cells for immunologic self-tolerance and negative control of immune responses. Annu. Rev. Immunol. 22:531–562. - PubMed
    1. Kriegel, M.A., T. Lohmann, C. Gabler, N. Blank, J.R. Kalden, and H.M. Lorenz. 2004. Defective suppressor function of human CD4+ CD25+ regulatory T cells in autoimmune polyglandular syndrome type II. J. Exp. Med. 199:1285–1291. - PMC - PubMed
    1. Crispin, J.C., A. Martinez, and J. Alcocer-Varela. 2003. Quantification of regulatory T cells in patients with systemic lupus erythematosus. J. Autoimmun. 21:273–276. - PubMed
    1. Cao, D., R. van Vollenhoven, L. Klareskog, C. Trollmo, and V. Malmstrom. 2004. CD25brightCD4+ regulatory T cells are enriched in inflamed joints of patients with chronic rheumatic disease. Arthritis Res. Ther. 6:R335–R346. - PMC - PubMed
    1. Ehrenstein, M.R., J.G. Evans, A. Singh, S. Moore, G. Warnes, D.A. Isenberg, and C. Mauri. 2004. Compromised function of regulatory T cells in rheumatoid arthritis and reversal by anti-TNFα therapy. J. Exp. Med. 200:277–285. - PMC - PubMed

Publication types

MeSH terms

Substances