. 2006 Jul 10;203(7):1701-11.
doi: 10.1084/jem.20060772. Epub 2006 Jul 3.

CD127 expression inversely correlates with FoxP3 and suppressive function of human CD4+ T reg cells

Affiliations

CD127 expression inversely correlates with FoxP3 and suppressive function of human CD4+ T reg cells

Weihong Liu et al. J Exp Med. .

Abstract

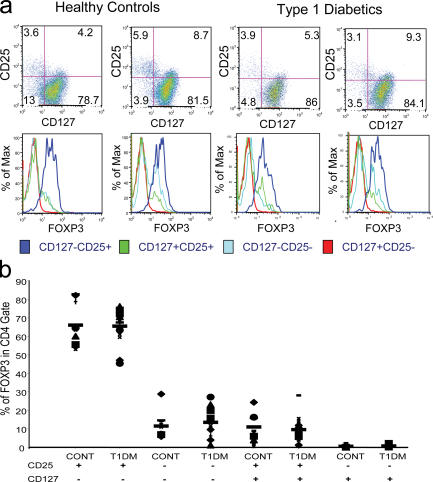
Regulatory T (T reg) cells are critical regulators of immune tolerance. Most T reg cells are defined based on expression of CD4, CD25, and the transcription factor, FoxP3. However, these markers have proven problematic for uniquely defining this specialized T cell subset in humans. We found that the IL-7 receptor (CD127) is down-regulated on a subset of CD4(+) T cells in peripheral blood. We demonstrate that the majority of these cells are FoxP3(+), including those that express low levels or no CD25. A combination of CD4, CD25, and CD127 resulted in a highly purified population of T reg cells accounting for significantly more cells that previously identified based on other cell surface markers. These cells were highly suppressive in functional suppressor assays. In fact, cells separated based solely on CD4 and CD127 expression were anergic and, although representing at least three times the number of cells (including both CD25(+)CD4(+) and CD25(-)CD4(+) T cell subsets), were as suppressive as the "classic" CD4(+)CD25(hi) T reg cell subset. Finally, we show that CD127 can be used to quantitate T reg cell subsets in individuals with type 1 diabetes supporting the use of CD127 as a biomarker for human T reg cells.


Figures

Figure 1.
Figure 1.
FoxP3 is expressed on a significant percentage of CD4+ T cells independent of CD25 expression. Human PBMCs were cell surface stained using a combination of anti-CD4 and anti-CD25 mAbs. Once fixed, the cells were stained additionally with anti-FoxP3 mAb. Data are representative of >20 independent individuals and >10 experiments. The numbers in the histograms indicate the percentage of FoxP3+ cells.
Figure 2.
Figure 2.
Expression of FoxP3 on different CD4+CD127+/− human T cell subsets. (a) PBMCs were harvested from human peripheral blood and stained with CD4, CD25, CD127 as well as intracellularly with FoxP3-specific mAbs, then analyzed on a Becton-Dickinson FACSCalibur. (b) Human PBMCs were stained for cell surface expression of CD4 and CD127. The stained cells were fixed and stained intracellularly for FoxP3. For analysis, the PBMCs were gated on lymphocytes (based on forward and side light scatter) and analyzed for CD127 and FoxP3 expression. The numbers in the dot plot indicate the percentage of gated cells expressing the relevant marker. Data are representative of >20 independent individuals and >10 experiments.
Figure 3.
Figure 3.
Expression of FoxP3 on different CD4+CD127+/− mouse T cell subsets. Mouse spleen and lymph node cells were stained for cell surface expression of CD4 and CD127. For analysis, the spleen cells from FoxP3-GFP mice were gated on lymphocytes (based on forward and side light scatter) and analyzed for CD127 and FoxP3 (GFP) expression. The numbers in the dot plot indicate the percentage of gated cells expressing the relevant marker. The letters A and B in the quadrants represent the gray and thick solid lines (bottom). (b) Spleen and lymph node cells isolated from FoxP3 transgenic mice were stained for cell surface expression of CD4, CD25, and CD127. For analysis, the spleen cells were gated on CD4+ lymphocytes (based on forward and side light scatter) and analyzed for CD127 and FoxP3 expression. The numbers in the dot plot indicate the percentage of gated cells expressing the relevant marker. The letters A, B, and C in the quadrants represent the dotted, thin solid, and thick solid lines (bottom).
Figure 4.
Figure 4.
Expression of FoxP3 on different CD4+ T cell subsets. (a) Human PBMCs were stained for cell surface expression of CD4, CD25, and CD127. The stained cells were fixed and stained intracellularly for FoxP3. For analysis, the PBMCs were gated on CD4+ lymphocytes (based on forward and side light scatter and CD4 staining) and analyzed for CD127 and FoxP3 expression. The boxes represent arbitrary designations of CD25+ versus CD25 cells. The numbers in the histograms indicate the percentage of gated cells expressing the relevant marker. (b) Human PBMCs were stained for cell surface expression of CD4, CD25, and CD127. The stained cells were fixed and stained intracellularly for FoxP3. For analysis, the PBMCs were gated on lymphocytes (based on forward and side light scatter) and analyzed for CD4, CD25, CD127, and FoxP3 expression. The boxes represent arbitrary designations of CD127+ versus CD127lo/− cells. The numbers in the dot plot indicate the percentage of gated cells expressing the relevant marker. (c) Similar staining and analysis was performed on whole blood obtained from 10 healthy individuals. Each symbol represents an individual person and the narrow bar represents the mean percentage of FoxP3+ T cells on either CD4+ T cells gated based on CD25 and/or CD127 expression.
Figure 5.
Figure 5.
ChIP-chip and ChIP-qPCR analysis of FoxP3 bound DNA from CD4+CD25hi human T reg cells. Anti-FoxP3 or control rabbit Ig was used to precipitate cross-linked protein–DNA complexes from expanded CD4+CD25hi human T reg cells lysate. The cross-linking of the immunoprecipitated material was removed and protease-treated and the DNA was purified and amplified. The resultant material was hybridized to the whole genome using GeneChip Human tiling 1.0R array set to identify the locations of binding sites for FoxP3. Two sets of graphs: FoxP3 IP versus the Ig control and FoxP3 IP versus Input DNA were generated on the hs.NCBIv35 version of the genome essentially following the method described in Cawley et el. (reference 50). (a) Signal enrichment graphs of IL-7R locus (chr5:35863179-35918811). Several regions in IL-7R locus are predicted to be positive (chr5:35892564-35892809 promoter) and negative (chr5:35890618-35890846 2K upstream; chr5:35907667-35907852 Intron 4; chr5:35911721-35911888 intron 7 and exon 8). (b) SYBR green qPCR of IL-7R chromosomal regions. FoxP3 IP versus the IgG fold enrichment ratio was determined from duplicate ChIP assay evaluated in duplicate by real time PCR.
Figure 6.
Figure 6.
Proliferative response of isolated T cell subsets. Buffy coat samples were sorted based on CD4, CD127, and CD25 expression. 30,000 sorted cells were put into culture with allogeneic anti-CD3–depleted, irradiated, third-party PBMCs as stimulators. T cells were incubated for 7 d at 37°C in 5% CO2. 16 h before the end of the incubation, 1 μCi 3H-thymidine was added to each well. Plates were harvested and data were analyzed. Data are representative of nine separate experiments.
Figure 7.
Figure 7.
Suppression of allogeneic MLR by individual T cell subsets. Buffy coat samples were sorted based on CD4, CD127 and CD25 expression. 30,000 sorted cells were combined with 100,000 autologous PBMCs as responders, and 100,000 allogeneic anti-CD3–depleted, irradiated third-party PBMCs as stimulators. T cells were incubated for 7 d at 37°C in 5% CO2. 16 h before the end of the incubation, 1 μCi 3H-thymidine was added to each well. Plates were harvested and data were analyzed. Data representative of nine separate experiments sorting seven different subpopulations of CD4+ cells indicated (a) CD127+CD25+, CD127+CD25, CD127lo/−CD25+, CD127lo/−CD25 and (b) CD127lo/−, CD25hi, CD127+. 100,000 responders are present in each well with decreasing numbers of sorted cells added at 1:1 ratio (30,000:100,000), 1:1/2 (15,000 sorted cells), 1:1/4 (7,500 sorted cells), 1:1/16 (1,875 sorted cells) in comparison to sorted cells alone. Results are represented as counts per minute (CPM).
Figure 8.
Figure 8.
Frequency of various T cell subsets in patients with T1D versus healthy control subjects. (a) FACS data are depicted from two healthy control and two individuals with T1D. Individual histograms are depicted to show the FoxP3 expression in CD4+ T cells subdivided into the various CD25 and CD127 subsets. (b) Individual FoxP3 expression data is depicted from total 10 healthy control individuals and 16 patients with T1D. Each symbol represents an individual subject and the narrow bar represents the mean percentage of FoxP3+ T cells in various T cell subsets (CD4+ T cells gated based on CD25 and/or CD127 expression as indicated at the bottom of the graph).

References

    1. Sakaguchi, S., N. Sakaguchi, J. Shimizu, S. Yamazaki, T. Sakihama, M. Itoh, Y. Kuniyasu, T. Nomura, M. Toda, and T. Takahashi. 2001. Immunologic tolerance maintained by CD25+ CD4+ regulatory T cells: their common role in controlling autoimmunity, tumor immunity, and transplantation tolerance. Immunol. Rev. 182:18–32. - PubMed
    1. Chatenoud, L., B. Salomon, and J.A. Bluestone. 2001. Suppressor T cells–they're back and critical for regulation of autoimmunity! Immunol. Rev. 182:149–163. - PubMed
    1. Wood, K.J., and S. Sakaguchi. 2003. Regulatory T cells in transplantation tolerance. Nat. Rev. Immunol. 3:199–210. - PubMed
    1. Singh, B., S. Read, C. Asseman, V. Malmstrom, C. Mottet, L.A. Stephens, R. Stepankova, H. Tlaskalova, and F. Powrie. 2001. Control of intestinal inflammation by regulatory T cells. Immunol. Rev. 182:190–200. - PubMed
    1. Curotto de Lafaille, M.A., and J.J. Lafaille. 2002. CD4(+) regulatory T cells in autoimmunity and allergy. Curr. Opin. Immunol. 14:771–778. - PubMed

Publication types

MeSH terms