. 2006 Jul 3;174(1):27-38.
doi: 10.1083/jcb.200603083.

Folding and organization of a contiguous chromosome region according to the gene distribution pattern in primary genomic sequence

Affiliations

Folding and organization of a contiguous chromosome region according to the gene distribution pattern in primary genomic sequence

Lindsay S Shopland et al. J Cell Biol. .

Abstract

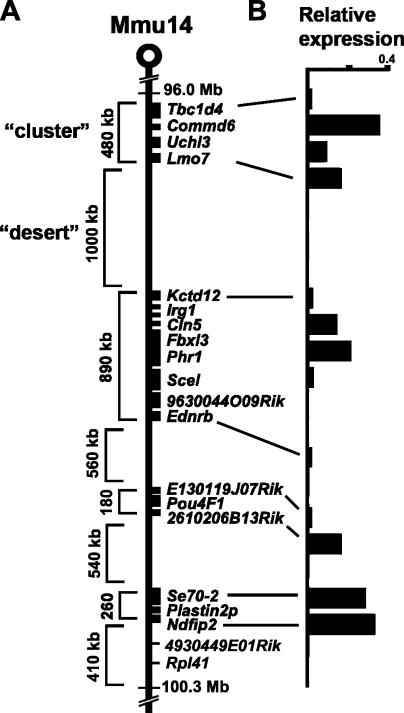
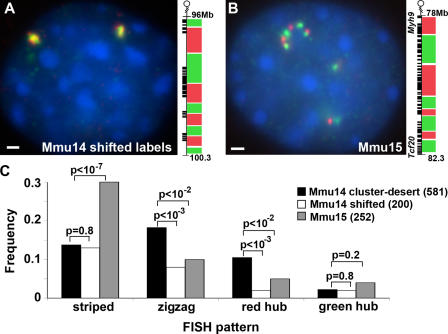
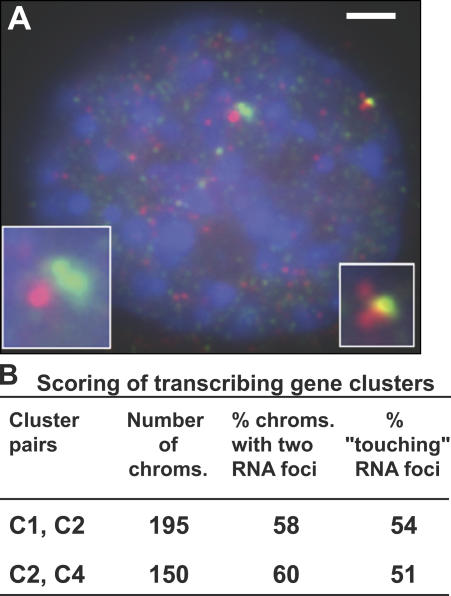
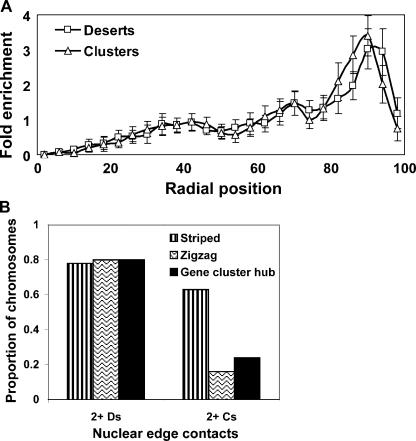
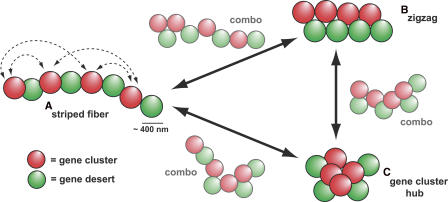
Specific mammalian genes functionally and dynamically associate together within the nucleus. Yet, how an array of many genes along the chromosome sequence can be spatially organized and folded together is unknown. We investigated the 3D structure of a well-annotated, highly conserved 4.3-Mb region on mouse chromosome 14 that contains four clusters of genes separated by gene "deserts." In nuclei, this region forms multiple, nonrandom "higher order" structures. These structures are based on the gene distribution pattern in primary sequence and are marked by preferential associations among multiple gene clusters. Associating gene clusters represent expressed chromatin, but their aggregation is not simply dependent on ongoing transcription. In chromosomes with aggregated gene clusters, gene deserts preferentially align with the nuclear periphery, providing evidence for chromosomal region architecture by specific associations with functional nuclear domains. Together, these data suggest dynamic, probabilistic 3D folding states for a contiguous megabase-scale chromosomal region, supporting the diverse activities of multiple genes and their conserved primary sequence organization.


Figures

Figure 1.
Figure 1.
A gene-poor region on Mmu14 contains gene clusters expressed in NIH-3T3 cells. (A) A 4.3-Mb gene-poor region (four genes/Mb) on Mmu14 contains only 19 genes and one pseudogene (black boxes). Genes are arranged in small clusters (<1 Mb) that are flanked by long, gene-poor sequences (deserts). Genomic locations are from mouse genome build 34 (http://oct2005.archive.ensembl.org/Mus_musculus/index.html). (B) Relative expression levels of Mmu14 region genes in NIH-3T3 cells were measured by quantitative RT-PCR.
Figure 2.
Figure 2.
Higher order chromosome structures revealed by probing the alternating pattern of gene clusters and deserts in Mmu14 primary sequence. (A) FISH labeling scheme to detect Mmu14 gene clusters in one color (rhodamine, red) and deserts in another (fluorescein, green). (B) Gene clusters (red) frequently group together and segregate from gene deserts (green) in NIH-3T3 nuclei (DAPI, blue). A separate singlet signal from the agrin locus on Mmu4 (green, bottom left) identifies prereplication (G1) cells. (C) 3D imaging revealed Mmu14 gene clusters and deserts in three predominant conformations, with indicated frequencies, as well as combinations of patterns (bottom right, combo [half striped/half zigzag]). Bars, 1 μm.
Figure 3.
Figure 3.
Mmu14 conformations are directly related to the pattern of gene distribution in primary sequence. (A) A shifted Mmu14-probing scheme breaks the color correspondence to Mmu14 clusters and deserts and produces greater overlap of red and green signals (yellow) in NIH-3T3 nuclei (DAPI, blue). (B) A similar probing scheme applied to a Mmu15 region lacking deserts frequently reveals extended striped fibers in nuclei. Only one Mmu15 homologue (top) is in full focus in this cell. (C) 2D scoring of G1 NIH-3T3 cells indicates that each of the nuclear patterns of labels differs significantly between Mmu14 cluster–desert–matched probes (clusters, red; deserts, green) and Mmu14 shifted and Mmu15 probes (P-values, χ2 tests). The distribution of all patterns also differed significantly between labeling schemes (P < 1 × 10⁻⁶, χ2 test). Numbers in parentheses are the sample size. Bars, 1 μm.
Figure 4.
Figure 4.
Nonrandom spatial association between gene clusters. (A) 1.7 Mb separates the centers of two Mmu14 gene clusters (C1 and C2) and two deserts (D1 and D2). (B) C1 and C2 FISH signals (left, green and red, respectively) and D1 and D2 (right, green and red, respectively) in NIH-3T3 nuclei. Bar, 0.5 μm. (C) Percentile ranking of 3D center–center distances between indicated clusters and deserts in 100 chromosomes. (D) Computational model of “random” chromosome territory organization in a mouse nucleus. Territories are color-coded and represented as a series of connected 1-Mb spheres, with positions randomized in simulations. Inset shows Mmu14 spheres (yellow) corresponding to the clusters and deserts under study. (E) Center–center distances between indicated clusters and deserts in 100 simulated Mmu14 chromosomes. P-values are from the KS test.
Figure 5.
Figure 5.
Mmu14 region folding differs from a simple random walk. The mean square distance between C1 and more distal points in the Mmu14 region was measured in NIH-3T3 nuclei. These data reveal a multiphasic relationship to genomic distance (solid lines), with at least two significant transitions in slope. This contrasts with a random walk polymer model (dashed line). Error bars represent the SEM.
Figure 6.
Figure 6.
Predominant cluster–desert conformations represent an activated chromosome region in multiple cell types. (A) Quantitative RT-PCR shows relative expression of Mmu14 gene clusters in chondrocytes (chond.), ES, and T cells, which were normalized to Gpi. (B) Frequencies of Mmu14 cluster–desert arrangements are similar in different cell types (P ≥ 0.1, χ2 test) and in DRB-treated NIH-3T3 cells (P ≥ 0.3, χ2 test) based on 2D scoring. Numbers in parentheses represent the sample size.
Figure 7.
Figure 7.
Actively transcribing gene clusters are not preferentially aggregated in nuclei. (A) RNA FISH of C2 (bright red foci) and C4 (bright green foci) shows spatially separated (center) and aggregated (right) transcription sites in an NIH-3T3 nucleus (DAPI, blue). Weaker red and green signals are transcripts dispersed from gene clusters. Bar, 1 μm. (B) Indicated pairs of RNA FISH signals in NIH-3T3 nuclei were scored for frequency of appearance and relative location (“touching”).
Figure 8.
Figure 8.
Mmu14 gene deserts preferentially align with the nuclear periphery. (A) Fold enrichment of gene clusters (triangles) and deserts (squares) according to 3D position along the nuclear radius, from nuclear center (0) to edge (100) defined by DAPI counterstain. Error bars represent the SEM. (B) From 3D reconstructions, chromosomes in the peripheral nuclear zone (>90% of nuclear radius) were classified by cluster–desert FISH pattern and then scored for frequency that two or more gene clusters (2+ Cs) or deserts (2+ Ds) contact the nuclear edge, which is marked by lamin B receptor immunostaining. Sample sizes were 25 clusters or deserts per FISH pattern.
Figure 9.
Figure 9.
Sequence-based, dynamic model of chromosome region structure. Dynamic conformations in interphase nuclei structurally manage the complex genetic information within a gene-poor chromosome region. Arrayed gene clusters (red) and deserts (green) of 200 kb–1 Mb act as building blocks for the formation of chromatin structures beyond the 30-nm fiber. Transient, probabilistic associations across a chromosome region, which are shown for gene clusters (dashed arrows), add up to predominant region conformations, such as a relatively linear striped fiber (A), a zigzag arrangement of gene clusters and deserts (B), and a centralized “gene cluster hub” with closely aggregated gene clusters (C). Intermediate combinations of the patterns (combo) further support dynamic transitions between one state and another (solid arrows). Though not shown, desert–desert and cluster–desert interactions also occur with defined probabilities.

Similar articles

Cited by

References

    1. Belmont, A.S., and K. Bruce. 1994. Visualization of G1 chromosomes: a folded, twisted, supercoiled chromonema model of interphase chromatid structure. J. Cell Biol. 127:287–302. - PMC - PubMed
    1. Blencowe, B.J., R. Issner, J.A. Nickerson, and P.A. Sharp. 1998. A coactivator of pre-mRNA splicing. Genes Dev. 12:996–1009. - PMC - PubMed
    1. Bolzer, A., G. Kreth, I. Solovei, D. Koehler, K. Saracoglu, et al. 2005. Three-dimensional maps of all chromosomes in human male fibroblast nuclei and prometaphase rosettes. PLoS Biol. 3:e157. - PMC - PubMed
    1. Bourque, G., E.M. Zdobnov, P. Bork, P.A. Pevzner, and G. Tesler. 2005. Comparative architectures of mammalian and chicken genomes reveal highly variable rates of genomic rearrangements across different lineages. Genome Res. 15:98–110. - PMC - PubMed
    1. Chambeyron, S., and W.A. Bickmore. 2004. Chromatin decondensation and nuclear reorganization of the HoxB locus upon induction of transcription. Genes Dev. 18:1119–1130. - PMC - PubMed

Publication types