Comparative Study
. 2006 Jul 3;174(1):89-100.
doi: 10.1083/jcb.200604072.

Isolation of quiescent and nonquiescent cells from yeast stationary-phase cultures

Affiliations
Comparative Study

Isolation of quiescent and nonquiescent cells from yeast stationary-phase cultures

Chris Allen et al. J Cell Biol. .

Abstract

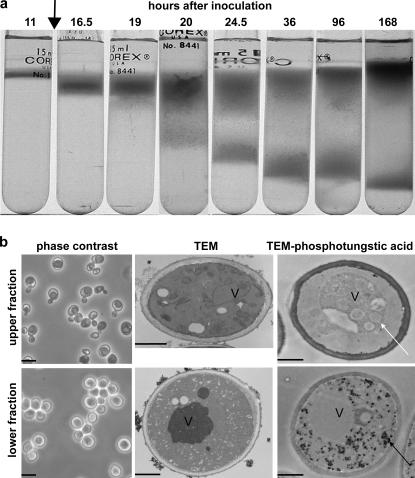
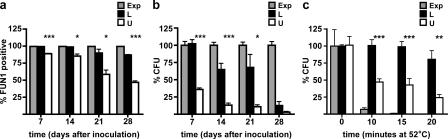
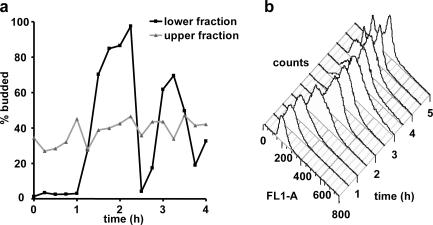
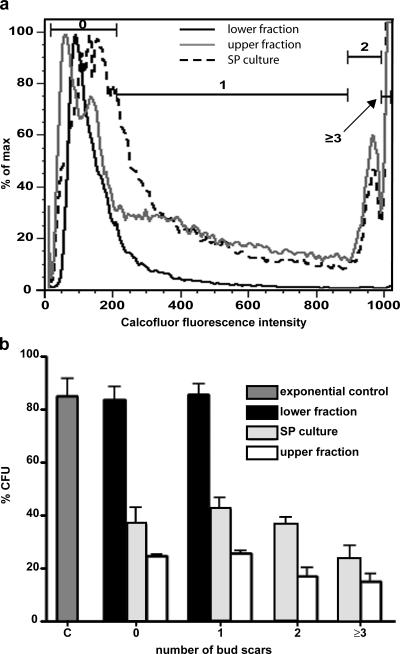
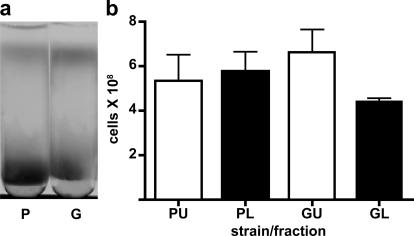
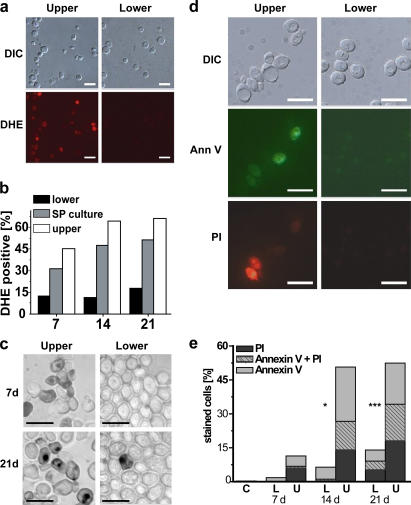
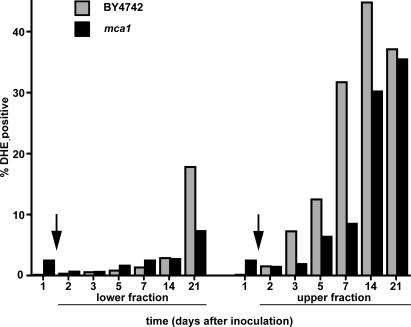
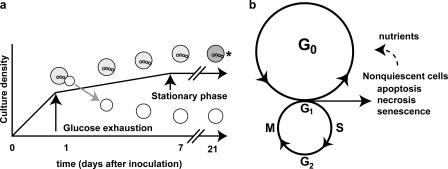
Quiescence is the most common and, arguably, most poorly understood cell cycle state. This is in part because pure populations of quiescent cells are typically difficult to isolate. We report the isolation and characterization of quiescent and nonquiescent cells from stationary-phase (SP) yeast cultures by density-gradient centrifugation. Quiescent cells are dense, unbudded daughter cells formed after glucose exhaustion. They synchronously reenter the mitotic cell cycle, suggesting that they are in a G(0) state. Nonquiescent cells are less dense, heterogeneous, and composed of replicatively older, asynchronous cells that rapidly lose the ability to reproduce. Microscopic and flow cytometric analysis revealed that nonquiescent cells accumulate more reactive oxygen species than quiescent cells, and over 21 d, about half exhibit signs of apoptosis and necrosis. The ability to isolate both quiescent and nonquiescent yeast cells from SP cultures provides a novel, tractable experimental system for studies of quiescence, chronological and replicative aging, apoptosis, and the cell cycle.


Figures

Figure 1.
Figure 1.
Two distinct cell populations are formed in yeast cultures entering SP. (a) Density-gradient separation of two distinct cell fractions in S288c cultures as a function of time after inoculation. Glucose exhaustion (arrow) occurred 12 h after inoculation. (b) Phase contrast, transmission EM (TEM), and phosphotungstic acid–stained transmission EM micrographs of upper- and lower-fraction cells from SP cultures (7 d after inoculation). The white arrow indicates vacuolar vesicles, and the black arrow indicates accumulated glycogen. V, vacuole. Bars: 10 μm (left); 1 μm (middle and right).
Figure 2.
Figure 2.
FUN-1 viability, colony-forming capacity, and thermotolerance of cells from upper and lower fractions from SP cultures. (a) Viability of cells from lower (L) and upper (U) fractions from 7-, 14-, 21-, and 28-d-old S288c SP cultures as determined by FUN-1 uptake measured by flow cytometry. Exponentially growing cells (Exp) were positive controls. (b) Colony-forming capacity of cells from S288c SP cultures determined by plating assay. Values are expressed as the percentage of colony-forming units (CFU) of exponentially growing cultures plated in parallel on each day. (c) Constitutive thermotolerance of cells from S288c SP cultures and fractions as well as exponentially growing cultures as a function of time at 52°C. At T = 0, the number of colonies produced by each population was normalized to 100%. Error bars indicate SD. *, P < 0.05; **, P < 0.01; ***, P < 0.001.
Figure 3.
Figure 3.
Lower-fraction, quiescent cells synchronously reenter the mitotic cell cycle. (a) Budding index as a function of time after inoculation into fresh, glucose-rich medium for nonquiescent, upper-fraction and quiescent, lower-fraction cells from S288c SP cultures. (b) DNA content as measured by SYBR Green I fluorescence (FL1-A) and flow cytometry of S288c quiescent, lower-fraction cells after inoculation into fresh, glucose-based media.
Figure 4.
Figure 4.
Replicative age and colony-forming capacity as a function of replicative age. (a) The number of bud scars as an indicator of replicative age was assayed by calcofluor white M2R staining and flow cytometry. Shown is the fluorescence-intensity histogram with gates set to sort cells by number of bud scars. Gates used to sort cells by bud scar number are indicated by the bracketed lines. (b) Colony-forming capacity of cells separated by number of bud scars from SP cultures, quiescent, lower fractions, and nonquiescent, upper fractions in panel a. Cells from unfractionated exponential cultures (C) were used as a positive control for colony-forming capacity. Error bars indicate SD.
Figure 5.
Figure 5.
Glycogen accumulation has only a slight effect on the density and number of cells in the quiescent, lower fraction. (a) Parental (P) and glc3 mutant (G) cells from SP cultures separated by density-gradient centrifugation. (b) Number of cells in nonquiescent, upper (U) and quiescent, lower (L) fractions in the parental and glc3 mutant strain. The results in panel b are the mean and SD of three biological replicates.
Figure 6.
Figure 6.
Evaluation of nonquiescent, upper-fraction and quiescent, lower-fraction cells for ROS, apoptosis, and necrosis. (a) DHE staining to detect ROS in cells from upper and lower fractions from 7-d-old S288c SP cultures. DIC, differential interference contrast. (b) Flow cytometric quantification of DHE-positive, fractionated 7-, 14-, and 21-d-old S288c cells. (c) TUNEL staining to detect DNA fragmentation in 7- and 21-d-old S289 nonquiescent, upper- and quiescent, lower-fraction cells. (d) Ann V and PI costaining of 14-d-old S289 cells. (e) Flow cytometric quantification of 7-, 14-, and 21-d-old S289 lower (L) and upper (U) fraction cells or exponentially growing (C) cells costained with AnnV and PI. Bars, 10 μm.
Figure 7.
Figure 7.
Evaluation of ROS in parental and metacaspase-deficient (mca1) strains. Flow cytometric quantification of DHE-positive parental BY4742 and mca1 mutant cells from upper and lower fractions of 1-, 2-, 3-, 5-, 7-, 14-, and 21-d-old cultures. Arrows indicate the time of glucose exhaustion (diauxic shift).
Figure 8.
Figure 8.
Models for the formation of quiescent and nonquiescent cells in chronologically aged yeast cultures and the relationship between the cells in SP cultures and the mitotic cell cycle. (a) After glucose exhaustion, during the diauxic shift, quiescent daughter cells are formed and can be isolated from nonquiescent cells by density. (b) Daughter cells produced during the diauxic shift enter G0 and reenter the mitotic cell cycle when nutrients become available. Nonquiescent cells are heterogeneous; may continue in the mitotic cell cycle; and can become senescent, apoptotic, or necrotic. As dead cells break down, they release nutrients that can be used by G0 cells (broken arrow to the G0 cycle). A small percentage of nonquiescent cells may retain the ability to reproduce when nutrients become available. The asterisk indicates a nonquiescent fraction that is heterogeneous and contains both budded and unbudded cells.

Similar articles

Cited by

References

    1. Abeliovich, H., and D.J. Klionsky. 2001. Autophagy in yeast: mechanistic insights and physiological function. Microbiol. Mol. Biol. Rev. 65:463–479. - PMC - PubMed
    1. Alcasabas, A.A., A.J. Osborn, J. Bachant, F.H. Hu, P.J.H. Werler, K. Bousset, K. Furuya, J.F.X. Diffley, A.M. Carr, and S.J. Elledge. 2001. Mrc1 transduces signals of DNA replication stress to activate Rad53. Nat. Cell Biol. 3:958–965. - PubMed
    1. Alexander, B.D., and J.R. Perfect. 1997. Antifungal resistance trends towards the year 2000. Implications for therapy and new approaches. Drugs. 54:657–678. - PubMed
    1. Aragon, A.D., G.A. Quiñones, E.V. Thomas, S. Roy, and M. Werner-Washburne. 2006. Release of extraction-resistant mRNA in stationary phase Saccharomyces cerevisiae produces a massive increase in transcript abundance in response to stress. Genome Biol. 7:R9; 10.1186/gb- 2006-7-2-r9. - PMC - PubMed
    1. Boddy, M.N., P.H.L. Gaillard, W.H. McDonald, P. Shanahan, J.R. Yates, and P. Russell. 2001. Mus81-Eme1 are essential components of a Holliday junction resolvase. Cell. 107:537–548. - PubMed

Publication types

MeSH terms