. 2006 Jul 11;45(27):8358-67.
doi: 10.1021/bi0604734.

Inhibition of hemoglobin S polymerization in vitro by a novel 15-mer EF-helix beta73 histidine-containing peptide

Affiliations

Inhibition of hemoglobin S polymerization in vitro by a novel 15-mer EF-helix beta73 histidine-containing peptide

Mohammed G K Akbar et al. Biochemistry. .

Abstract

Our mutational studies on Hb S showed that the Hb S beta73His variant (beta6Val and beta73His) promoted polymerization, while Hb S beta73Leu (beta6Val and beta73Leu) inhibited polymerization. On the basis of these results, we speculated that EF-helix peptides containing beta73His interact with beta4Thr in Hb S and compete with Hb S, resulting in inhibition of Hb S polymerization. We, therefore, studied inhibitory effects of 15-, 11-, 7-, and 3-mer EF-helix peptides containing beta73His on Hb S polymerization. The delay time prior to Hb S polymerization increased only in the presence of the 15-mer His peptide; the higher the amount, the longer the delay time. DIC image analysis also showed that the fiber elongation rate for Hb S polymers decreased with increasing concentration of the 15-mer His peptide. In contrast, the same 15-mer peptide containing beta73Leu instead of His and peptides shorter than 11 amino acids containing beta73His including His alone showed little effect on the kinetics of polymerization and elongation of polymers. Analysis by protein-chip arrays showed that only the 15-mer beta73His peptide interacted with Hb S. CD spectra of the 15-mer beta73His peptide did not show a specific helical structure; however, computer docking analysis suggested a lower energy for interaction of Hb S with the 15-mer beta73His peptide compared to peptides containing other amino acids at this position. These results suggest that the 15-mer beta73His peptide interacts with Hb S via the beta4Thr in the betaS-globin chain in Hb S. This interaction may influence hydrogen bond interaction between beta73Asp and beta4Thr in Hb S polymers and interfere in hydrophobic interactions of beta6Val, leading to inhibition of Hb S polymerization.


Figures

Figure 1
Figure 1. Kinetics of polymerization of Hb S in the presence and absence of the β73 His- or Leu-containing peptides
Kinetics of deoxy Hb S (4 g/dl) polymerization were measured in the presence (b) or absence of the 3-fold molar excess β73His peptide (a) (3 moles of peptide per mole of hemoglobin tetramer to Hb S dissolved in 0.5% (v/v) acetonitrile in 1.0 M phosphate buffer at 30°C by the temperature-jump method (panel A). Delay times prior to polymerization of Hb S (4g/dl) also were measured in the presence of a 3-fold molar excess of the 15-mer β73His [3 (H)] or β73Leu peptides [3 (L)], and mean values compared to Hb S alone (0) or Hb S in the presence of 0.5%(v/v) acetonitrile (0+A) (panel B).
Figure 2
Figure 2. Effect of the β73 His peptide concentration on delay time prior to polymerization of Hb S in 1.8 M phosphate buffer
Delay times prior to Hb S (0.18 g/dl) polymerization were measured in 1.8 M phosphate buffer, pH 7.3 at 30° C at increasing amounts of the β73His peptide, and results compared to those following addition of the 15-mer β73Leu peptide. 0, 0 +A, 1(H), 3(H), 5(H) and 5(L) on the x-axis represent Hb S alone, Hb S in 0.5% (v/v) acetonitrile; and, Hb S in the presence of a 1-, 3- or 5-fold molar excess of β73 His peptide, respectively. Results also are shown using a 5-fold molar excess of the β73Leu peptide [5(L)].
Figure 3
Figure 3. Effect of the β73His peptide on Hb S solubility in 1.0 M phosphate buffer
Solubility of Hb S in 1.0 M phosphate buffer was measured in the presence of varying amounts of the 15-mer β73His peptide [1-(1H), 3-(3H) and 5-(5 H) fold molar ratio] in the presence of 0.5% (v/v) acetonitrile, and results compared to those using the 15-mer β73Leu peptide [5-fold molar excess, 5(L)] in the presence of 0.5% (v/v) acetonitrile. Solubility following completion of polymerization was assessed after centrifugation. Solubilities of Hb S alone (0) and in the presence of 0.5% (v/v) acetonitrile (0 +A) also were measured with values representing the mean of two measurements (maximum different ranges of the two values are within 3.3%).
Figure 4
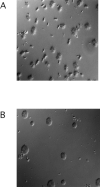
Figure 4. DIC images of deoxy Hb S polymers in the presence of the β73His peptide
DIC images of Hb S (4g/dl) polymers in 1.0 M phosphate buffer (pH 7.3) at room temperature after 4.30 min (A) and 9 min (B) following initiation of polymerization by temperature-jump are shown in the absence (panel A) and presence (panel B) of a 5-fold molar excess of the β73His peptide.
Figure 5
Figure 5. DIC images of Hb S fiber growth in a single domain in the presence and absence of β73His peptide as a function of time
DIC images of Hb S (4 g/dl) polymer growth from a single domain in the presence (B) and absence (A) of a 5-fold molar excess of the 15-mer β73His peptide as a function of time were measured in 1.0 M phosphate buffer (pH 7.3). Frames a, b, c, and d in panel A represent images at 100, 128, 156 and 290 sec, respectively, while frames a, b, c, and d in panel B represent images at 160, 186, 274 and 486 sec, respectively. Experimental conditions are the same as those of Figure 4.
Figure 6
Figure 6. Effect of β73His peptide on Hb S polymer elongation rate
Elongation rate of Hb S polymers in 1.0 M phosphate buffer at room temperature in the absence (0) and presence of a 5-fold molar excess of the β73His-[5 (H)] or Leu-[5(L)] containing peptides in the presence of 0.5% (v/v) acetonitrile was determined by DIC (A). Results were compared to Hb S alone (0) and Hb S in 0.5 % (v/v) acetonitrile (0 + A). Effects of the 15-mer β73His peptide concentration on elongation rates (B) and 5-fold molar excess of shorter peptides (11-, 7- and 3-mer) as well as His alone (C) also were calculated by DIC image analysis. Numbers on x axes in panel C represent 0 (no peptides), 1 (His alone) while 3, 7, 11 and 15 represent 3-mer, 7-mer, 11-mer and 15-mer peptides, respectively. Experimental conditions and rate calculations are the same as those in Fig. 5.
Figure 7
Figure 7. Detection of β73His peptide binding to Hb S using SELDI-TOF MS
The amine groups on the surface of Hb S (8 pM) in the oxy form were coupled to a RS100 chip, and peptide bound to Hb S was measured by a SELDI-TOF MS system. A and A’ are mass traces of the 15-mer β73 His and Leu Hb S-bound peptides, respectively, using 4 pM initial peptide concentration, while B and B’ show results using 8 pM peptide concentrations, respectively. C and C’ are mass traces of 4 an 8 pM of the 11-mer His peptide. The X- and Y-axes represent mass (m/z) and signal intensity of bound peptide, respectively.
Figure 8
Figure 8. Circular dichroism spectra of β73His and β73Leu peptides
Circular dichroism (CD) spectra of the 15-mer β73His (A) and Leu peptides (B) solubilized in 0.5%(v/v) acetonitrile compared to acetonitrile alone (C) were analyzed at room temperature using an Aviv model 62 DS instrument employing a 1 mm light path cuvette equipped with a thermoelectric module.
Figure 9
Figure 9. Molecular docking simulations of 15-mer β73 peptides with β4 Thr in the βS–globin chain
Computer docking simulations of the 15-mer β73His- (a) and Leu- (b) containing peptides with β4Thr in the βS–globin chain were compared using BioMedCAChe software (Ver. 6, Fujitsu, Tokyo). β73 His and Leu positions relative to β4 Thr in the βS–globin chain are from lowest energy values for interactions based on energy calculations using computer simulations.

Similar articles

Cited by

References

    1. Eaton WA, Hofrichter J. Sickle cell hemoglobin polymerization. Adv Protein Chem. 1990;40:63–279. - PubMed
    1. Bunn HF, Forget BG. Hemoglobin: Molecular and Clinical Aspects. Sanders; Philadelphia.: 1996.
    1. Ferrone FA, Hofrichter J, Eaton WA. Kinetics of sickle hemoglobin polymerization. II. A double nucleation mechanism. J Mol Biol. 1985;183:611–631. - PubMed
    1. Embury SH, Hebbel RP, Mohandus N, Steinberg MH. SICKLE CELL DISEASE: Basic principles and clinical practice. Raven Press; New York: 1994.
    1. Harrington DJ, Adachi K, Royer WE., Jr. The high resolution crystal structure of deoxyhemoglobin S. J Mol Biol. 1997;272:398–407. - PubMed

Publication types