

Changes in nucleolar morphology and proteins during infection with the coronavirus infectious bronchitis virus
- PMID: 16819967
- PMCID: PMC7162191
- DOI: 10.1111/j.1462-5822.2006.00698.x
Changes in nucleolar morphology and proteins during infection with the coronavirus infectious bronchitis virus
Abstract
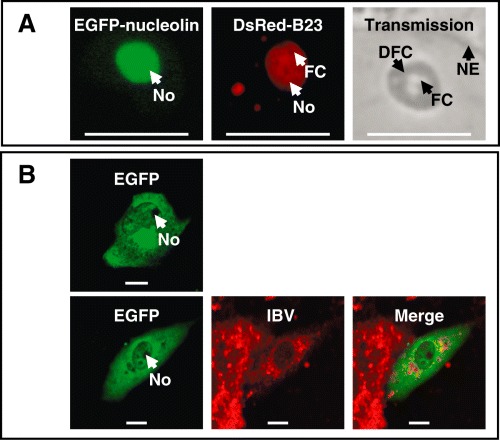
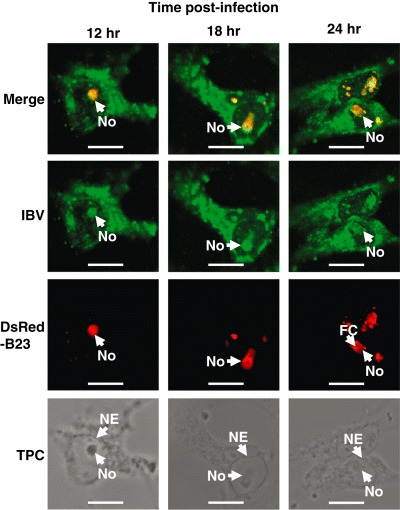
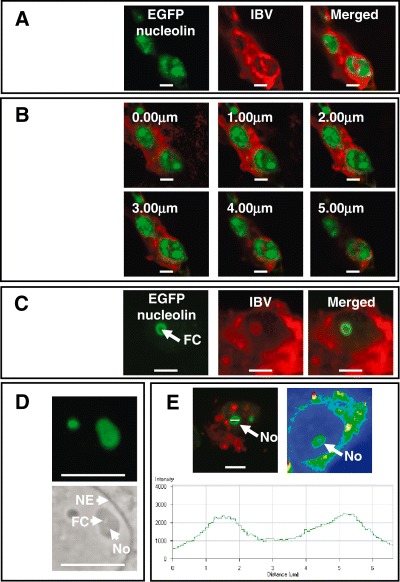
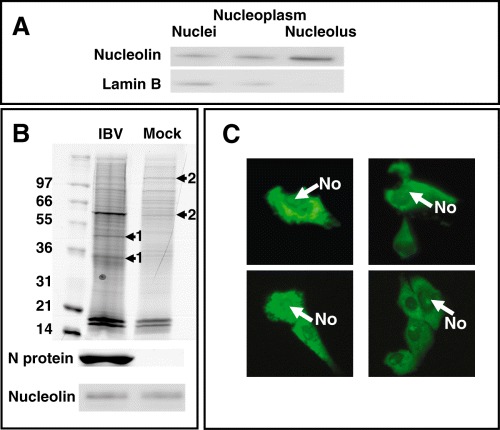
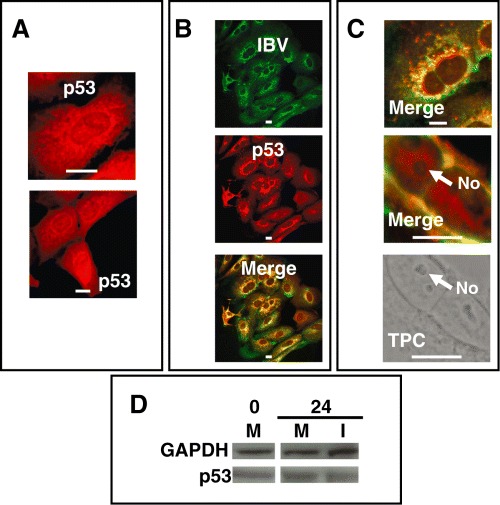
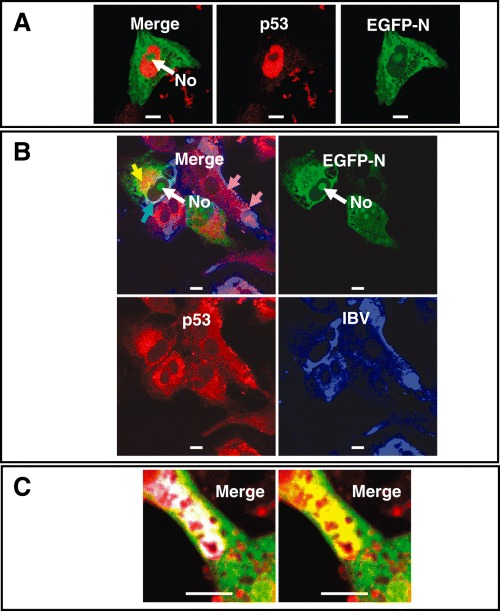
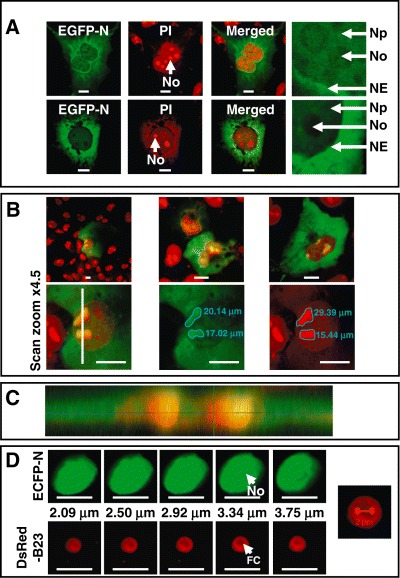
The nucleolus is a dynamic subnuclear structure involved in ribosome subunit biogenesis, cell cycle control and mediating responses to cell stress, among other functions. While many different viruses target proteins to the nucleolus and recruit nucleolar proteins to facilitate virus replication, the effect of infection on the nucleolus in terms of morphology and protein content is unknown. Previously we have shown that the coronavirus nucleocapsid protein will localize to the nucleolus. In this study, using the avian infectious bronchitis coronavirus, we have shown that virus infection results in a number of changes to the nucleolus both in terms of gross morphology and protein content. Using confocal microscopy coupled with fluorescent labelled nucleolar marker proteins we observed changes in the morphology of the nucleolus including an enlarged fibrillar centre. We found that the tumour suppressor protein, p53, which localizes normally to the nucleus and nucleolus, was redistributed predominately to the cytoplasm.
Figures
Similar articles
-
The coronavirus infectious bronchitis virus nucleoprotein localizes to the nucleolus.J Virol. 2001 Jan;75(1):506-12. doi: 10.1128/JVI.75.1.506-512.2001. J Virol. 2001. PMID: 11119619 Free PMC article.
-
Elucidation of the avian nucleolar proteome by quantitative proteomics using SILAC and changes in cells infected with the coronavirus infectious bronchitis virus.Proteomics. 2010 Oct;10(19):3558-62. doi: 10.1002/pmic.201000139. Proteomics. 2010. PMID: 20827733 Free PMC article.
-
Delineation and modelling of a nucleolar retention signal in the coronavirus nucleocapsid protein.Traffic. 2006 Jul;7(7):833-48. doi: 10.1111/j.1600-0854.2006.00424.x. Epub 2006 May 25. Traffic. 2006. PMID: 16734668 Free PMC article.
-
RNA viruses: hijacking the dynamic nucleolus.Nat Rev Microbiol. 2007 Feb;5(2):119-27. doi: 10.1038/nrmicro1597. Nat Rev Microbiol. 2007. PMID: 17224921 Free PMC article. Review.
-
Involvement of the plant nucleolus in virus and viroid infections: parallels with animal pathosystems.Adv Virus Res. 2010;77:119-58. doi: 10.1016/B978-0-12-385034-8.00005-3. Adv Virus Res. 2010. PMID: 20951872 Free PMC article. Review.
Cited by
-
Characterisation of the RNA binding properties of the coronavirus infectious bronchitis virus nucleocapsid protein amino-terminal region.FEBS Lett. 2006 Oct 30;580(25):5993-8. doi: 10.1016/j.febslet.2006.09.052. Epub 2006 Oct 2. FEBS Lett. 2006. PMID: 17052713 Free PMC article.
-
Nuclear NAD+ synthase nicotinamide mononucleotide adenylyltransferase 1 contributes to nuclear atypia and promotes glioma growth.Neurooncol Adv. 2025 Feb 3;7(1):vdaf029. doi: 10.1093/noajnl/vdaf029. eCollection 2025 Jan-Dec. Neurooncol Adv. 2025. PMID: 40321618 Free PMC article.
-
Nucleolar and Ribosomal DNA Structure under Stress: Yeast Lessons for Aging and Cancer.Cells. 2019 Jul 26;8(8):779. doi: 10.3390/cells8080779. Cells. 2019. PMID: 31357498 Free PMC article. Review.
-
Non-Coding RNA-Driven Regulation of rRNA Biogenesis.Int J Mol Sci. 2020 Dec 20;21(24):9738. doi: 10.3390/ijms21249738. Int J Mol Sci. 2020. PMID: 33419375 Free PMC article. Review.
-
Characterisation of cyclin D1 down-regulation in coronavirus infected cells.FEBS Lett. 2007 Apr 3;581(7):1275-86. doi: 10.1016/j.febslet.2007.02.039. Epub 2007 Feb 28. FEBS Lett. 2007. PMID: 17359980 Free PMC article.
References
-
- Andersen, J.S. , Lyon, C.E. , Fox, A.H. , Leung, A.K.L. , Lam, Y.W. , Steen, H. , et al. (2002) Directed proteomic analysis of the human nucleolus. Curr Biol 12: 1–11. - PubMed
-
- Andersen, J.S. , Lam, Y.W. , Leung, A.K. , Ong, S.E. , Lyon, C.E. , Lamond, A.I. , and Mann, M. (2005) Nucleolar proteome dynamics. Nature 433: 77–83. - PubMed
Publication types
MeSH terms
Substances
Grants and funding
LinkOut - more resources
Full Text Sources
Other Literature Sources
Research Materials
Miscellaneous
