

Calcium-induced calcium release in rod photoreceptor terminals boosts synaptic transmission during maintained depolarization
- PMID: 16819987
- PMCID: PMC2474468
- DOI: 10.1111/j.1460-9568.2006.04845.x
Calcium-induced calcium release in rod photoreceptor terminals boosts synaptic transmission during maintained depolarization
Abstract
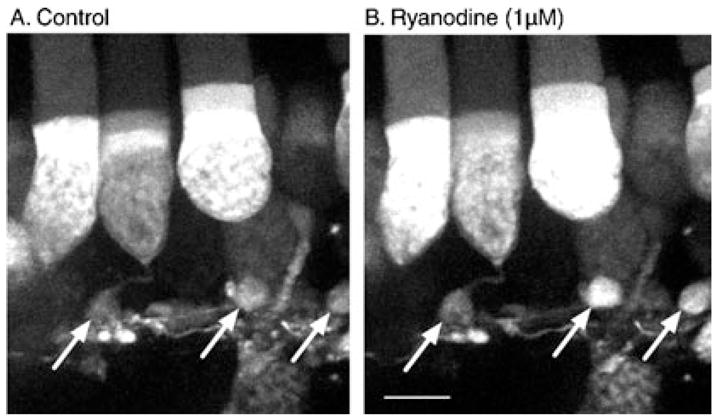
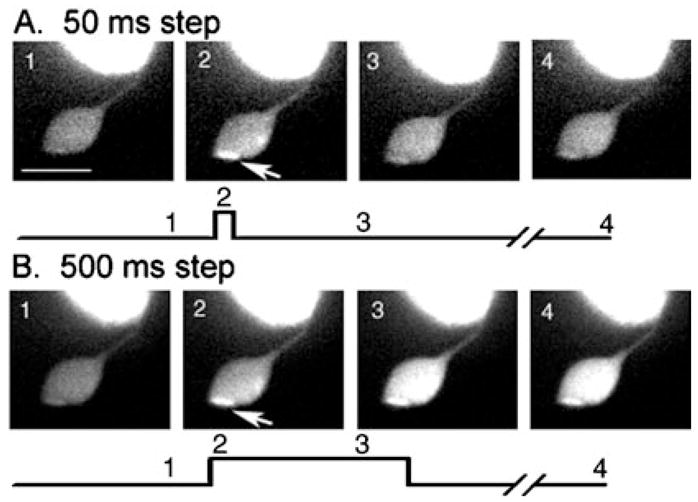
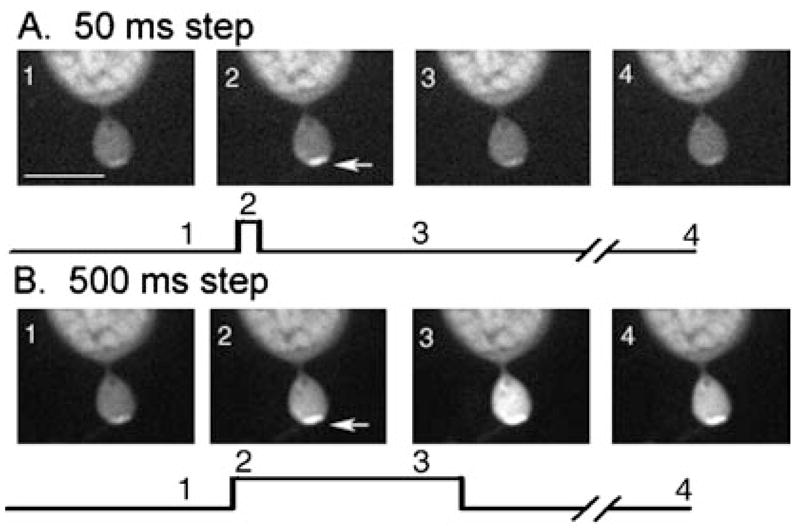
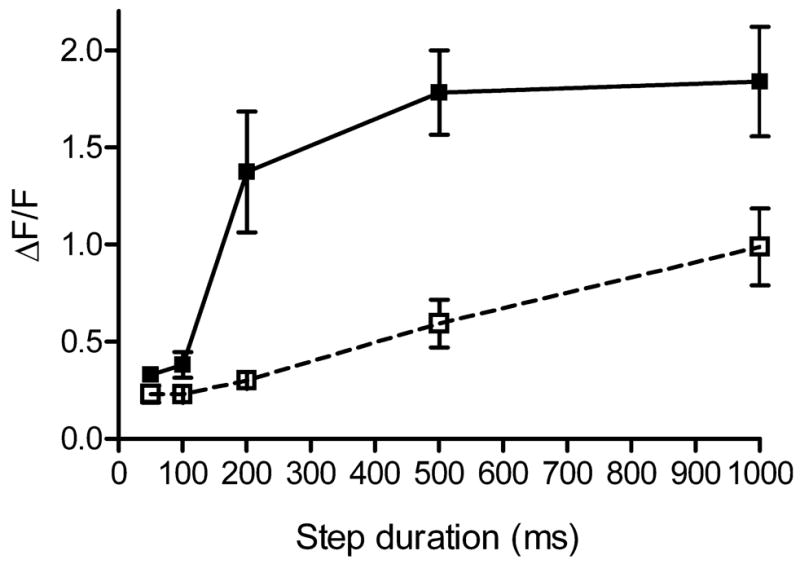
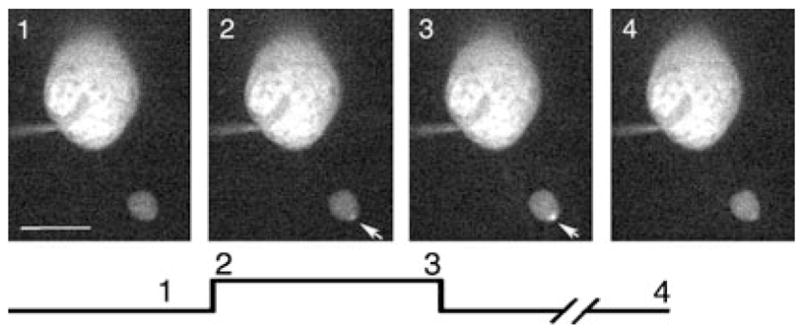
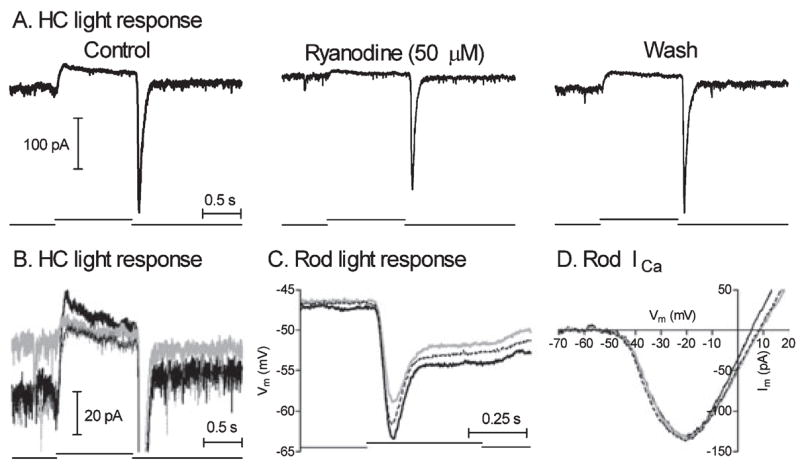
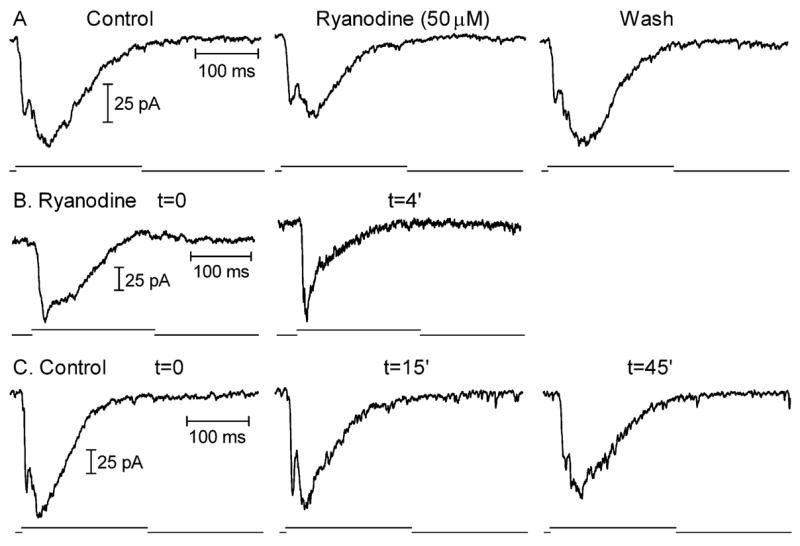
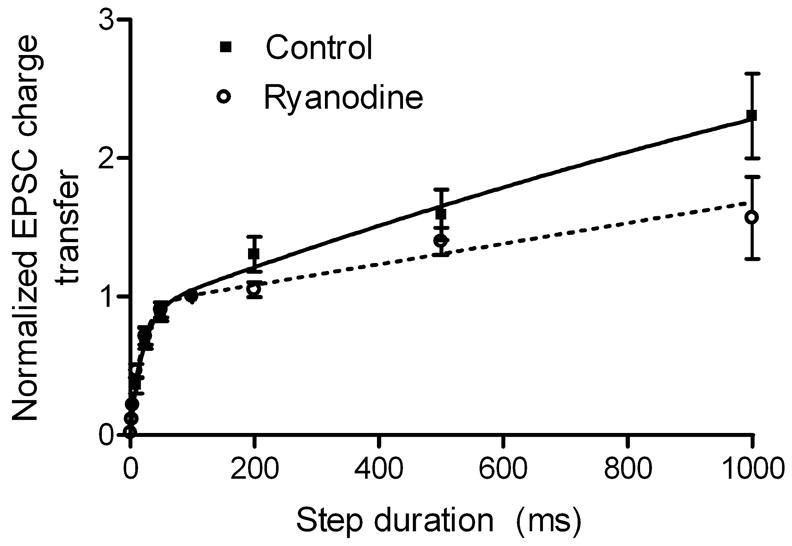
We examined the contribution of calcium-induced calcium release (CICR) to synaptic transmission from rod photoreceptor terminals. Whole-cell recording and confocal calcium imaging experiments were conducted on rods with intact synaptic terminals in a retinal slice preparation from salamander. Low concentrations of ryanodine stimulated calcium increases in rod terminals, consistent with the presence of ryanodine receptors. Application of strong depolarizing steps (-70 to -10 mV) exceeding 200 ms or longer in duration evoked a wave of calcium that spread across the synaptic terminals of voltage-clamped rods. This secondary calcium increase was blocked by high concentrations of ryanodine, indicating it was due to CICR. Ryanodine (50 microm) had no significant effect on rod calcium current (I(ca)) although it slightly diminished rod light-evoked voltage responses. Bath application of 50 microm ryanodine strongly inhibited light-evoked currents in horizontal cells. Whether applied extracellularly or delivered into the rod cell through the patch pipette, ryanodine (50 microm) also inhibited excitatory post-synaptic currents (EPSCs) evoked in horizontal cells by depolarizing steps applied to rods. Ryanodine caused a preferential reduction in the later portions of EPSCs evoked by depolarizing steps of 200 ms or longer. These results indicate that CICR enhances calcium increases in rod terminals evoked by sustained depolarization, which in turn acts to boost synaptic exocytosis from rods.
Figures
Similar articles
-
Calcium-induced calcium release contributes to synaptic release from mouse rod photoreceptors.Neuroscience. 2010 Feb 17;165(4):1447-56. doi: 10.1016/j.neuroscience.2009.11.032. Epub 2009 Nov 22. Neuroscience. 2010. PMID: 19932743 Free PMC article.
-
Kinetics of exocytosis is faster in cones than in rods.J Neurosci. 2005 May 4;25(18):4633-40. doi: 10.1523/JNEUROSCI.4298-04.2005. J Neurosci. 2005. PMID: 15872111 Free PMC article.
-
Ca2+ Diffusion through Endoplasmic Reticulum Supports Elevated Intraterminal Ca2+ Levels Needed to Sustain Synaptic Release from Rods in Darkness.J Neurosci. 2015 Aug 12;35(32):11364-73. doi: 10.1523/JNEUROSCI.0754-15.2015. J Neurosci. 2015. PMID: 26269643 Free PMC article.
-
Fluoxetine inhibits calcium-activated currents of salamander rod photoreceptor somata and presynaptic terminals via modulation of intracellular calcium dynamics.Mol Vis. 2005 Dec 28;11:1200-10. Mol Vis. 2005. PMID: 16402020
-
Presynaptic calcium stores contribute to nicotine-elicited potentiation of evoked synaptic transmission at CA3-CA1 connections in the neonatal rat hippocampus.Hippocampus. 2007;17(4):316-25. doi: 10.1002/hipo.20271. Hippocampus. 2007. PMID: 17330864
Cited by
-
Kinetics of Inhibitory Feedback from Horizontal Cells to Photoreceptors: Implications for an Ephaptic Mechanism.J Neurosci. 2016 Sep 28;36(39):10075-88. doi: 10.1523/JNEUROSCI.1090-16.2016. Epub 2016 Sep 28. J Neurosci. 2016. PMID: 27683904 Free PMC article.
-
Voltage- and calcium-gated ion channels of neurons in the vertebrate retina.Prog Retin Eye Res. 2019 Sep;72:100760. doi: 10.1016/j.preteyeres.2019.05.001. Epub 2019 May 10. Prog Retin Eye Res. 2019. PMID: 31078724 Free PMC article. Review.
-
Calcium-induced calcium release contributes to synaptic release from mouse rod photoreceptors.Neuroscience. 2010 Feb 17;165(4):1447-56. doi: 10.1016/j.neuroscience.2009.11.032. Epub 2009 Nov 22. Neuroscience. 2010. PMID: 19932743 Free PMC article.
-
Endoplasmic reticulum (ER) Ca2+-channel activity contributes to ER stress and cone death in cyclic nucleotide-gated channel deficiency.J Biol Chem. 2017 Jul 7;292(27):11189-11205. doi: 10.1074/jbc.M117.782326. Epub 2017 May 11. J Biol Chem. 2017. PMID: 28495882 Free PMC article.
-
The molecular architecture of ribbon presynaptic terminals.Mol Neurobiol. 2009 Apr;39(2):130-48. doi: 10.1007/s12035-009-8058-z. Epub 2009 Mar 3. Mol Neurobiol. 2009. PMID: 19253034 Free PMC article. Review.
References
-
- Al-Baldawi NF, Abercrombie RF. Calcium diffusion coefficient in Myxicola axoplasm. Cell Calcium. 1995;17:422–430. - PubMed
-
- Allbritton NLT, Meyer &, Stryer L. Range of messenger action of calcium ion and inositol 1,4,5-trisphosphate. Science. 1992;258:1812–1815. - PubMed
-
- Attwell D, Borges S, Wu SM, Wilson M. Signal clipping by the rod output synapse. Nature. 1987;328:522–524. - PubMed
-
- Beurg M, Hafidi A, Skinner LJ, Ruel J, Nouvian R, Henaff M, Puel JL, Aran JM, Dulon D. Ryanodine receptors and BK channels act as a presynaptic depressor of neurotransmission in cochlear inner hair cells. Eur J Neurosci. 2005;22:1109–1119. - PubMed
Publication types
MeSH terms
Substances
Grants and funding
LinkOut - more resources
Full Text Sources
Miscellaneous
