

Microarray evidence of glutaminyl cyclase gene expression in melanoma: implications for tumor antigen specific immunotherapy
- PMID: 16820060
- PMCID: PMC1557589
- DOI: 10.1186/1479-5876-4-27
Microarray evidence of glutaminyl cyclase gene expression in melanoma: implications for tumor antigen specific immunotherapy
Abstract
Background: In recent years encouraging progress has been made in developing vaccine treatments for cancer, particularly with melanoma. However, the overall rate of clinically significant results has remained low. The present research used microarray datasets from previous investigations to examine gene expression patterns in cancer cell lines with the goal of better understanding the tumor microenvironment.
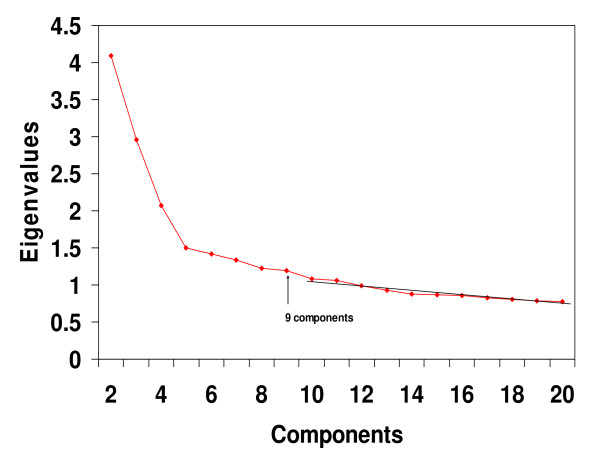
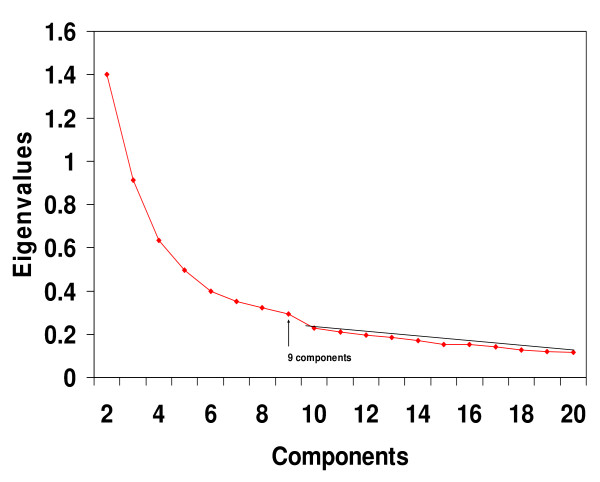
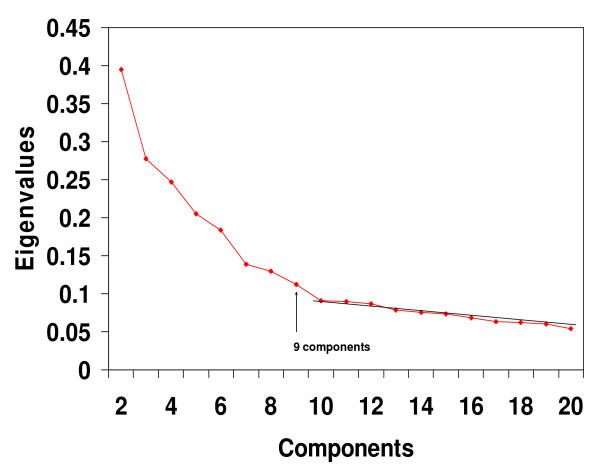
Methods: Principal Components Analyses with Promax rotational transformations were carried out with 90 cancer cell lines from 3 microarray datasets, which had been made available on the internet as supplementary information from prior publications.
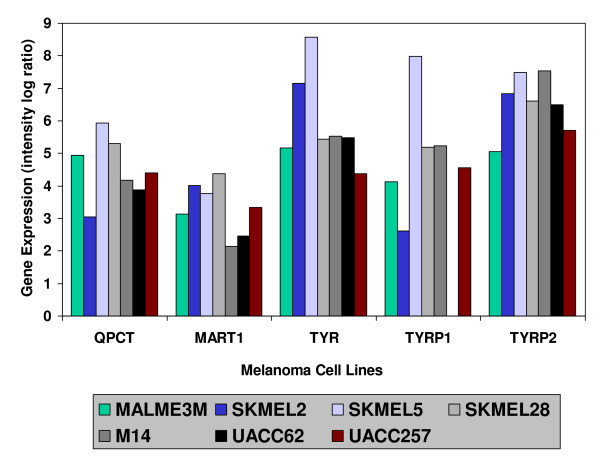
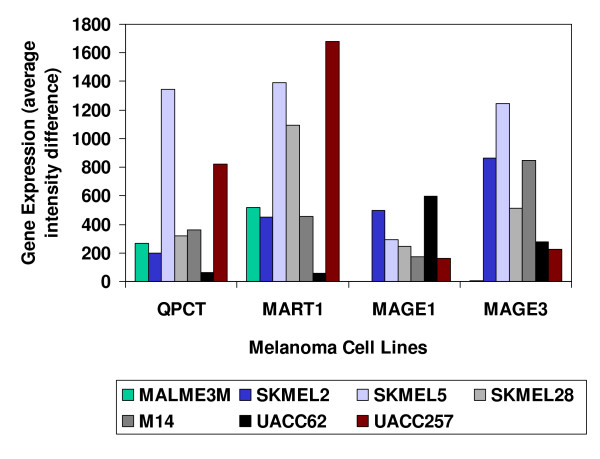
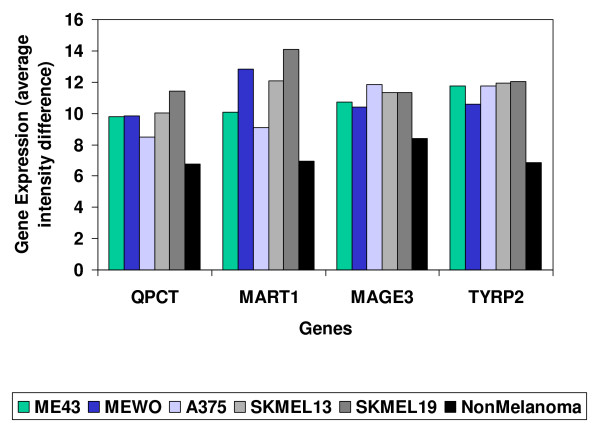
Results: In each of the analyses a well defined melanoma component was identified that contained a gene coding for the enzyme, glutaminyl cyclase, which was as highly expressed as genes from a variety of well established biomarkers for melanoma, such as MAGE-3 and MART-1, which have frequently been used in clinical trials of melanoma vaccines.
Conclusion: Since glutaminyl cyclase converts glutamine and glutamic acid into a pyroglutamic form, it may interfere with the tumor destructive process of vaccines using peptides having glutamine or glutamic acid at their N-terminals. Finding ways of inhibiting the activity of glutaminyl cyclase in the tumor microenvironment may help to increase the effectiveness of some melanoma vaccines.
Figures
Similar articles
-
Therapeutic gene modified cell based cancer vaccines.Gene. 2013 Aug 10;525(2):200-7. doi: 10.1016/j.gene.2013.03.056. Epub 2013 Apr 6. Gene. 2013. PMID: 23566846 Review.
-
Concordant loss of melanoma differentiation antigens in synchronous and asynchronous melanoma metastases: implications for immunotherapy.Melanoma Res. 2006 Apr;16(2):137-45. doi: 10.1097/01.cmr.0000200489.55099.20. Melanoma Res. 2006. PMID: 16567969
-
Predictive gene signature in MAGE-A3 antigen-specific cancer immunotherapy.J Clin Oncol. 2013 Jul 1;31(19):2388-95. doi: 10.1200/JCO.2012.44.3762. Epub 2013 May 28. J Clin Oncol. 2013. PMID: 23715562 Clinical Trial.
-
Detection of naturally processed and HLA-A1-presented melanoma T-cell epitopes defined by CD8(+) T-cells' release of granulocyte-macrophage colony-stimulating factor but not by cytolysis.Clin Cancer Res. 1996 Jan;2(1):87-95. Clin Cancer Res. 1996. PMID: 9816095
-
An update on malignant melanoma vaccine research: insights into mechanisms for improving the design and potency of melanoma therapeutic vaccines.Am J Clin Dermatol. 2007;8(3):123-41. doi: 10.2165/00128071-200708030-00001. Am J Clin Dermatol. 2007. PMID: 17492842 Review.
Cited by
-
Melanocytes in the skin--comparative whole transcriptome analysis of main skin cell types.PLoS One. 2014 Dec 29;9(12):e115717. doi: 10.1371/journal.pone.0115717. eCollection 2014. PLoS One. 2014. PMID: 25545474 Free PMC article.
-
Repurposing FDA-Approved Compounds for the Discovery of Glutaminyl Cyclase Inhibitors as Drugs Against Alzheimer's Disease.ChemistryOpen. 2021 Sep;10(9):877-881. doi: 10.1002/open.202000235. Epub 2020 Dec 30. ChemistryOpen. 2021. PMID: 33377311 Free PMC article.
-
Molecular characterization of tick salivary gland glutaminyl cyclase.Insect Biochem Mol Biol. 2013 Sep;43(9):781-93. doi: 10.1016/j.ibmb.2013.05.011. Epub 2013 Jun 13. Insect Biochem Mol Biol. 2013. PMID: 23770496 Free PMC article.
-
Role of glutaminyl-peptide cyclotransferase in breast cancer doxorubicin sensitivity.Cancer Biol Ther. 2024 Dec 31;25(1):2321767. doi: 10.1080/15384047.2024.2321767. Epub 2024 Feb 28. Cancer Biol Ther. 2024. PMID: 38417050 Free PMC article.
-
QPCT regulation by CTCF leads to sunitinib resistance in renal cell carcinoma by promoting angiogenesis.Int J Oncol. 2021 Jul;59(1):48. doi: 10.3892/ijo.2021.5228. Epub 2021 May 26. Int J Oncol. 2021. PMID: 34036385 Free PMC article.
References
-
- van der Bruggen P, Traversari C, Chomez P, Lurquin C, De Plaen E, Van den Eynde B, Knuth A, Boon T. A gene encoding an antigen recognized by cytolytic T lymphocytes on a human melanoma. Science. 1991;254:1643–1647. - PubMed
-
- Kawakami Y, Eliyahu S, Delgado CH, Robbins PF, Sakaguchi K, Appella E, Yannelli JR, Adema GJ, Miki T, Rosenberg SA. Identification of a human melanoma antigen recognized by tumor-infiltrating lymphocytes associated with in vivo tumor rejection. Proc Natl Acad Sci U S A. 1994;91:6458–6462. doi: 10.1073/pnas.91.14.6458. - DOI - PMC - PubMed
LinkOut - more resources
Full Text Sources
Other Literature Sources
