Diversity of Planctomycetes in soil in relation to soil history and environmental heterogeneity
- PMID: 16820439
- PMCID: PMC1489350
- DOI: 10.1128/AEM.00149-06
Diversity of Planctomycetes in soil in relation to soil history and environmental heterogeneity
Erratum in
- Appl Environ Microbiol. 2006 Sep;72(9):6429
Abstract
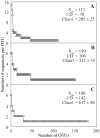
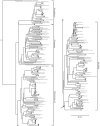
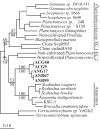
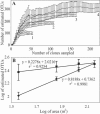
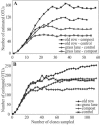
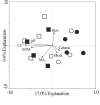
Members of the Planctomycetes, which were once thought to occur primarily in aquatic environments, have been discovered in soils on five continents, revealing that these Bacteria are a widespread and numerically abundant component of microbial communities in soil. We examined the diversity of Planctomycetes in soil samples obtained from experimental plots at an agricultural site in order to assess the extent of Planctomycetes diversity in soil, to determine whether management effects such as past land cover and compost addition affected the composition of the Planctomycetes community, and to determine whether the observations made could provide insight into the ecological distribution of these organisms. Analysis of Planctomycetes 16S rRNA gene sequences revealed a total of 312 +/- 35 unique phylotypes in the soil at the site examined. The majority of these Planctomycetes sequences were unique, and the sequences had phylogenetic affiliations that included all major lineages in the Planctomycetaceae, as well as several novel groups of deeply divergent Planctomycetes. Both soil management history and compost amendment had significant effects on the Planctomycetes diversity, and variations in soil organic matter, Ca2+ content, and pH were associated with variations in the Planctomycetes community composition. In addition, Planctomycetes richness increased in proportion to the area sampled and was correlated with the spatial heterogeneity of nitrate, which was associated with the soil management history at the orchard site examined. This report provides the first systematic assessment of the diversity of Planctomycetes in soil and also provides evidence that the diversity of this group increases with area as defined by the general power law description of the taxon-area relationship.
Figures

References
-
- Axelrood, P. E., M. L. Chow, C. C. Radomski, J. M. McDermott, and J. Davies. 2002. Molecular characterization of bacterial diversity from British Columbia forest soils subjected to disturbance. Can. J. Microbiol. 48:655-674. - PubMed
-
- Bauer, M., T. Lombardot, H. Teeling, N. L. Ward, R. Amann, and F. Glockner. 2004. Archaea-like genes for C-1-transfer enzymes in Planctomycetes: phylogenetic implications of their unexpected presence in this phylum. J. Mol. Evol. 59:571-586. - PubMed
-
- Bell, T., D. Ager, J. I. Song, J. A. Newman, I. P. Thompson, A. K. Lilley, and C. J. van der Gast. 2005. Larger islands house more bacterial taxa. Science 308:1884. - PubMed
-
- Bohannan, B. J. M., and J. Hughes. 2003. New approaches to analyzing microbial biodiversity data. Curr. Opin. Microbiol. 6:282-287. - PubMed
Publication types
MeSH terms
Substances
Associated data
- Actions
- Actions
- Actions
- Actions
- Actions
- Actions
- Actions
- Actions
- Actions
- Actions
- Actions
- Actions
- Actions
- Actions
- Actions
- Actions
- Actions
- Actions
- Actions
- Actions
- Actions
- Actions
- Actions
- Actions
- Actions
- Actions
- Actions
- Actions
- Actions
- Actions
- Actions
- Actions
- Actions
- Actions
- Actions
- Actions
- Actions
- Actions
- Actions
- Actions
- Actions
- Actions
- Actions
- Actions
- Actions
- Actions
- Actions
- Actions
- Actions
- Actions
- Actions
- Actions
- Actions
- Actions
- Actions
- Actions
- Actions
- Actions
- Actions
- Actions
- Actions
- Actions
- Actions
- Actions
- Actions
- Actions
- Actions
- Actions
- Actions
- Actions
- Actions
- Actions
- Actions
- Actions
- Actions
- Actions
- Actions
- Actions
- Actions
- Actions
- Actions
- Actions
- Actions
- Actions
- Actions
- Actions
- Actions
- Actions
- Actions
- Actions
- Actions
- Actions
- Actions
- Actions
- Actions
- Actions
- Actions
- Actions
- Actions
- Actions
- Actions
- Actions
- Actions
- Actions
- Actions
- Actions
- Actions
- Actions
- Actions
- Actions
- Actions
- Actions
- Actions
- Actions
- Actions
- Actions
- Actions
- Actions
- Actions
- Actions
- Actions
- Actions
- Actions
- Actions
- Actions
- Actions
- Actions
- Actions
- Actions
- Actions
- Actions
- Actions
- Actions
- Actions
- Actions
- Actions
- Actions
- Actions
- Actions
- Actions
- Actions
- Actions
- Actions
- Actions
- Actions
- Actions
- Actions
- Actions
- Actions
- Actions
- Actions
- Actions
- Actions
- Actions
- Actions
- Actions
- Actions
- Actions
- Actions
- Actions
- Actions
- Actions
- Actions
- Actions
- Actions
- Actions
- Actions
- Actions
- Actions
- Actions
- Actions
- Actions
- Actions
- Actions
- Actions
- Actions
- Actions
- Actions
- Actions
- Actions
- Actions
- Actions
- Actions
- Actions
- Actions
- Actions
- Actions
- Actions
- Actions
- Actions
- Actions
- Actions
- Actions
- Actions
- Actions
- Actions
- Actions
- Actions
- Actions
- Actions
- Actions
- Actions
- Actions
- Actions
- Actions
- Actions
- Actions
- Actions
- Actions
- Actions
- Actions
- Actions
- Actions
- Actions
- Actions
- Actions
- Actions
- Actions
- Actions
- Actions
- Actions
- Actions
- Actions
LinkOut - more resources
Full Text Sources
Molecular Biology Databases
Miscellaneous

