Effects of low-shear modeled microgravity on cell function, gene expression, and phenotype in Saccharomyces cerevisiae
- PMID: 16820445
- PMCID: PMC1489333
- DOI: 10.1128/AEM.03050-05
Effects of low-shear modeled microgravity on cell function, gene expression, and phenotype in Saccharomyces cerevisiae
Abstract
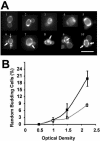
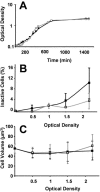
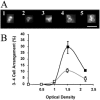
Only limited information is available concerning the effects of low-shear modeled microgravity (LSMMG) on cell function and morphology. We examined the behavior of Saccharomyces cerevisiae grown in a high-aspect-ratio vessel, which simulates the low-shear and microgravity conditions encountered in spaceflight. With the exception of a shortened lag phase (90 min less than controls; P < 0.05), yeast cells grown under LSMMG conditions did not differ in growth rate, size, shape, or viability from the controls but did differ in the establishment of polarity as exhibited by aberrant (random) budding compared to the usual bipolar pattern of controls. The aberrant budding was accompanied by an increased tendency of cells to clump, as indicated by aggregates containing five or more cells. We also found significant changes (greater than or equal to twofold) in the expression of genes associated with the establishment of polarity (BUD5), bipolar budding (RAX1, RAX2, and BUD25), and cell separation (DSE1, DSE2, and EGT2). Thus, low-shear environments may significantly alter yeast gene expression and phenotype as well as evolutionary conserved cellular functions such as polarization. The results provide a paradigm for understanding polarity-dependent cell responses to microgravity ranging from pathogenesis in fungi to the immune response in mammals.
Figures


Similar articles
-
Yeast genomic expression patterns in response to low-shear modeled microgravity.BMC Genomics. 2007 Jan 3;8:3. doi: 10.1186/1471-2164-8-3. BMC Genomics. 2007. PMID: 17201921 Free PMC article.
-
The influence of microgravity on invasive growth in Saccharomyces cerevisiae.Astrobiology. 2011 Jan-Feb;11(1):45-55. doi: 10.1089/ast.2010.0518. Astrobiology. 2011. PMID: 21345087
-
Response of Staphylococcus aureus physiology and Agr quorum sensing to low-shear modeled microgravity.J Bacteriol. 2024 Sep 19;206(9):e0027224. doi: 10.1128/jb.00272-24. Epub 2024 Aug 9. J Bacteriol. 2024. PMID: 39120147 Free PMC article.
-
Spaceflight and modeled microgravity effects on microbial growth and virulence.Appl Microbiol Biotechnol. 2010 Jan;85(4):885-91. doi: 10.1007/s00253-009-2237-8. Epub 2009 Oct 22. Appl Microbiol Biotechnol. 2010. PMID: 19847423 Free PMC article. Review.
-
Ubiquitin-dependent control of development in Saccharomyces cerevisiae.Curr Opin Microbiol. 2004 Dec;7(6):647-54. doi: 10.1016/j.mib.2004.10.016. Curr Opin Microbiol. 2004. PMID: 15556038 Review.
Cited by
-
The Unicellular State as a Point Source in a Quantum Biological System.Biology (Basel). 2016 May 27;5(2):25. doi: 10.3390/biology5020025. Biology (Basel). 2016. PMID: 27240413 Free PMC article.
-
Simulated Microgravity Created Using a Random Positioning Machine Induces Changes in the Physiology of the Fusarium solani Species Complex.Microorganisms. 2022 Nov 16;10(11):2270. doi: 10.3390/microorganisms10112270. Microorganisms. 2022. PMID: 36422340 Free PMC article.
-
Transcriptional profiling of protein expression related genes of Pichia pastoris under simulated microgravity.PLoS One. 2011;6(11):e26613. doi: 10.1371/journal.pone.0026613. Epub 2011 Nov 2. PLoS One. 2011. PMID: 22073176 Free PMC article.
-
Yeast genomic expression patterns in response to low-shear modeled microgravity.BMC Genomics. 2007 Jan 3;8:3. doi: 10.1186/1471-2164-8-3. BMC Genomics. 2007. PMID: 17201921 Free PMC article.
-
Simulated microgravity compromises mouse oocyte maturation by disrupting meiotic spindle organization and inducing cytoplasmic blebbing.PLoS One. 2011;6(7):e22214. doi: 10.1371/journal.pone.0022214. Epub 2011 Jul 13. PLoS One. 2011. PMID: 21765954 Free PMC article.
References
-
- Adams, A. 1997. Methods in yeast genetics: a Cold Spring Harbor Laboratory course manual. Cold Spring Harbor Laboratory Press, Cold Spring Harbor, N.Y.
-
- Amon, A. 1996. Mother and daughter are doing fine: asymmetric cell division in yeast. Cell 84:651-654. - PubMed
-
- Ausubel, F. M., E. Brent, R. E. Kingston, D. D. Moore, J. G. Seidman, J. A. Smith, and K. Struhl. 1995. Current protocols in molecular biology. Wiley, New York, N.Y.
-
- Ballester, M., A. Castello., E. Ibanez, A. Sanchez, and J. M. Folch. 2004. Real-time quantitative PCR-based system for determining transgene copy number in transgenic animals. BioTechniques 37:610-613. - PubMed
Publication types
MeSH terms
Substances
Grants and funding
LinkOut - more resources
Full Text Sources
Molecular Biology Databases

