

Estimation of Staphylococcus aureus growth parameters from turbidity data: characterization of strain variation and comparison of methods
- PMID: 16820481
- PMCID: PMC1489309
- DOI: 10.1128/AEM.00251-06
Estimation of Staphylococcus aureus growth parameters from turbidity data: characterization of strain variation and comparison of methods
Abstract
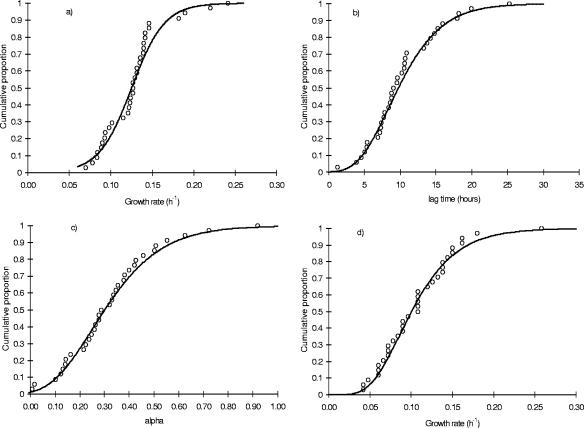
Turbidity methods offer possibilities for generating data required for addressing microorganism variability in risk modeling given that the results of these methods correspond to those of viable count methods. The objectives of this study were to identify the best approach for determining growth parameters based on turbidity data and use of a Bioscreen instrument and to characterize variability in growth parameters of 34 Staphylococcus aureus strains of different biotypes isolated from broiler carcasses. Growth parameters were estimated by fitting primary growth models to turbidity growth curves or to detection times of serially diluted cultures either directly or by using an analysis of variance (ANOVA) approach. The maximum specific growth rates in chicken broth at 17 degrees C estimated by time to detection methods were in good agreement with viable count estimates, whereas growth models (exponential and Richards) underestimated growth rates. Time to detection methods were selected for strain characterization. The variation of growth parameters among strains was best described by either the logistic or lognormal distribution, but definitive conclusions require a larger data set. The distribution of the physiological state parameter ranged from 0.01 to 0.92 and was not significantly different from a normal distribution. Strain variability was important, and the coefficient of variation of growth parameters was up to six times larger among strains than within strains. It is suggested to apply a time to detection (ANOVA) approach using turbidity measurements for convenient and accurate estimation of growth parameters. The results emphasize the need to consider implications of strain variability for predictive modeling and risk assessment.
Figures
Similar articles
-
Estimation of Mycobacterium avium subsp. paratuberculosis growth parameters: strain characterization and comparison of methods.Appl Environ Microbiol. 2011 Dec;77(24):8615-24. doi: 10.1128/AEM.05818-11. Epub 2011 Oct 14. Appl Environ Microbiol. 2011. PMID: 22003015 Free PMC article.
-
Effect of the growth environment on the strain variability of Salmonella enterica kinetic behavior.Food Microbiol. 2011 Jun;28(4):828-37. doi: 10.1016/j.fm.2010.04.006. Epub 2010 Apr 21. Food Microbiol. 2011. PMID: 21511146
-
Comparison of two optical-density-based methods and a plate count method for estimation of growth parameters of Bacillus cereus.Appl Environ Microbiol. 2010 Mar;76(5):1399-405. doi: 10.1128/AEM.02336-09. Epub 2010 Jan 15. Appl Environ Microbiol. 2010. PMID: 20081006 Free PMC article.
-
Media used in the detection and enumeration of Staphylococcus aureus.Int J Food Microbiol. 1995 Jun;26(1):15-24. doi: 10.1016/0168-1605(93)e0028-p. Int J Food Microbiol. 1995. PMID: 7662517 Review.
-
Comparison of microbiological and physicochemical methods for enumeration of microorganisms.Postepy Hig Med Dosw (Online). 2014 Jan 2;68:1392-6. doi: 10.5604/17322693.1130086. Postepy Hig Med Dosw (Online). 2014. PMID: 25531702 Review.
Cited by
-
Photobacterium angustum and Photobacterium kishitanii, Psychrotrophic High-Level Histamine-Producing Bacteria Indigenous to Tuna.Appl Environ Microbiol. 2016 Jan 29;82(7):2167-2176. doi: 10.1128/AEM.02833-15. Appl Environ Microbiol. 2016. PMID: 26826233 Free PMC article.
-
Evaluation of Strain Variability in Inactivation of Campylobacter jejuni in Simulated Gastric Fluid by Using Hierarchical Bayesian Modeling.Appl Environ Microbiol. 2021 Jul 13;87(15):e0091821. doi: 10.1128/AEM.00918-21. Epub 2021 Jul 13. Appl Environ Microbiol. 2021. PMID: 34047637 Free PMC article.
-
Bacterial colony size growth estimation by deep learning.BMC Microbiol. 2023 Oct 26;23(1):307. doi: 10.1186/s12866-023-03053-y. BMC Microbiol. 2023. PMID: 37880630 Free PMC article.
-
The formation of Staphylococcus aureus enterotoxin in food environments and advances in risk assessment.Virulence. 2011 Nov-Dec;2(6):580-92. doi: 10.4161/viru.2.6.18122. Epub 2011 Nov 1. Virulence. 2011. PMID: 22030860 Free PMC article. Review.
-
Quantifying Variability in Growth and Thermal Inactivation Kinetics of Lactobacillus plantarum.Appl Environ Microbiol. 2016 Jul 29;82(16):4896-908. doi: 10.1128/AEM.00277-16. Print 2016 Aug 15. Appl Environ Microbiol. 2016. PMID: 27260362 Free PMC article.
References
-
- Augustin, J. C., L. Rosso, and V. Carlier. 1999. Estimation of temperature dependent growth rate and lag time of Listeria monocytogenes by optical density measurements. J. Microbiol. Methods 38:137-146. - PubMed
-
- Baranyi, J., and T. A. Roberts. 1995. Mathematics of predictive food microbiology. Int. J. Food Microbiol. 26:199-218. - PubMed
-
- Barbosa, W. B., L. Cabedo, H. J. Wederquist, J. N. Sofos, and G. R. Schmidt. 1994. Growth variation among species and strains of Listeria in culture broth. J. Food Prot. 57:765-769. - PubMed
Publication types
MeSH terms
Substances
LinkOut - more resources
Full Text Sources
