. 2006:2:36.
doi: 10.1038/msb4100075. Epub 2006 Jul 4.

Markov propagation of allosteric effects in biomolecular systems: application to GroEL-GroES

Affiliations

Markov propagation of allosteric effects in biomolecular systems: application to GroEL-GroES

Chakra Chennubhotla et al. Mol Syst Biol. 2006.

Abstract

We introduce a novel approach for elucidating the potential pathways of allosteric communication in biomolecular systems. The methodology, based on Markov propagation of 'information' across the structure, permits us to partition the network of interactions into soft clusters distinguished by their coherent stochastics. Probabilistic participation of residues in these clusters defines the communication patterns inherent to the network architecture. Application to bacterial chaperonin complex GroEL-GroES, an allostery-driven structure, identifies residues engaged in intra- and inter-subunit communication, including those acting as hubs and messengers. A number of residues are distinguished by their high potentials to transmit allosteric signals, including Pro33 and Thr90 at the nucleotide-binding site and Glu461 and Arg197 mediating inter- and intra-ring communication, respectively. We propose two most likely pathways of signal transmission, between nucleotide- and GroES-binding sites across the cis and trans rings, which involve several conserved residues. A striking observation is the opposite direction of information flow within cis and trans rings, consistent with negative inter-ring cooperativity. Comparison with collective modes deduced from normal mode analysis reveals the propensity of global hinge regions to act as messengers in the transmission of allosteric signals.


Figures

Figure 1
Figure 1
Structure of the GroEL–GroES complex. (A) Space-filling model from the crystal structure determined by Xu et al (1997) (Protein Data Bank (PDB): 1AON). GroEL has a cylindrical structure, composed of two rings, termed the cis and trans rings, depending on the position of the GroES cap. Each ring in GroEL is composed of seven subunits. One subunit in each ring is shown in color (red, green and blue) in (A), along with one of the chains of the heptameric co-chaperonin (shown in gray/slate). The colored subunits on the GroES cap and the GroEL cis and trans rings correspond to three representative chains (identified as chains R, D and K in the PDB file (Berman et al, 2000)) whose communication dynamics will be examined below (see Figure 3C). (B) and (C) display ribbon diagrams of these two subunits belonging to the cis and trans rings, respectively. Each subunit consists of three domains, A, I and E, which refer to the apical, intermediate and equatorial domains, respectively. The corresponding residue ranges are: [A] Met193–Gly375; [I] Cys138–Gly192 (I1) and Val376–Gly410 (I2); and [E] Met1–Pro137 (E1) and Val411–Pro525 (E2). ADP molecule bound to the equatorial domain of the cis ring subunit is displayed in pink in panel B.
Figure 2
Figure 2
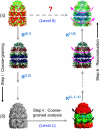
Hierarchical network decomposition overview. Step i: mapping of the structure to its optimal reduced level representation (coarse-graining); step ii: structural/dynamic analysis—for example, GNM analysis of collective dynamics (Bahar et al, 1997; Haliloglu et al, 1997)—in the reduced space; and step iii: reconstruction of the detailed structure dynamics. The communication/couplings of residues at a given level are assumed to obey a Markov propagation process consistent with the distribution of atom–atom contacts in the original structure. Steps i and iii are achieved by two sets of operators, R for model reduction and K for model reconstruction (Chennubhotla and Jepson, 2005) explained in Materials and methods. Several models of intermediate complexity (not shown) are usually generated between the highest and lowest levels. R and K at each level ensure that similar stochastic characteristics (signal propagation probabilities and stationary distribution of communication) are retained between successive levels of the hierarchy. In particular, the reduction operator R(l,l+1) propagates residue information from level l to l+1. Successive multiplication of such transformation matrices, as in R(0,L)=∏l=0L−1 R(l,l+1), ensures the passage of information from the original, or the highest, resolution representation (level 0) to the most reduced level (level L) of the hierarchy. The arrows on the right illustrate the most cooperative motion (counter-rotation of the two rings) predicted by elastic network model analysis of GroEL–GroES(ADP)7 (Keskin et al, 2002).
Figure 3
Figure 3
Soft partitioning of the chaperonin complex into stochastically coherent clusters. A total of 35 clusters are identified at reduced level 4, each shown by a different color in (A). Owing to the seven-fold cylindrical symmetry, five distinct types of clusters are observed: clusters (I) 1–7 centered on the GroES monomers, (II) 8–14 centered on A–I domains of the cis ring subunits, (III) 15–21 around the E-domain of cis ring subunits, (IV) 22–28 near the E–I domains of trans ring subunits and (V) 29–35 near A–I domains of trans ring subunits. (B) displays The soft participation of residues in two example clusters encircled in panel A, clusters 11 (top) and 32 (bottom) respectively, by ribbon diagrams, color-coded red–orange–yellow–green–cyan in the order of decreasing probabilistic participation. Results are valid for all cylindrically related seven subunits along the heptameric rings, but for illustration we focus on chains D (yellow) and E (magenta) on cis ring, J (pink) and K (green) on trans ring and R (blue) on GroES, in (C). (D) shows ownership distributions (curves in color) for representative clusters of different types, numbered 1–7, 11, 18, 25 and 32, with the associated clusters shown in color on the ribbon diagrams to the right. The labels on the abscissa indicate the chain identities: A–G on cis ring, H–N on trans ring and O–U on GroES cap. The gray curve in each panel shows the maximal responsibility curve deduced from the maxima of all ownership curves. The portions of the ownership curves, which overlap with the maximal responsibility curve, define the hard clusters displayed in panel A.
Figure 4
Figure 4
A closer view of intra- and inter-subunit couplings at the interface of the clusters. Results are shown for the representative chains D (yellow) and E (magenta) on cis ring, J (pink) and K (green) on trans ring and R (blue) on GroES. The chain segments that establish the communication between clusters are colored orange. (A) Residues Glu18–Ala33 in the mobile loop (orange) of GroES chain R integrated into the cluster centered at the A-domain of chain D establish the communication between cis ring and co-chaperonin. (B) Positive intra-ring cooperativity imparted by the coupling of chain E residues, Val38–Ile49 and Ala384-Val387 shown in orange, into cluster 18 dominated by chain D. (C) Inter-subunit couplings at trans ring A-domains. Cluster 32 embodies the A-domain of chain K, but also captures a few residues (Val381–Lys392, Asp179–Leu183; shown in orange) from chain J. (D) Cluster 25 is centered on the E-domain of chain K on trans ring. Note that this cluster engages E1 residues Arg36–Lys51 from chain J. Negative cooperativity between the two rings can be compared by comparing panels B and D, both corresponding to the E-domains of the respective cis and trans rings. The residues serving as messengers (orange) between the subunits belong to either clockwise (panel B) or counterclockwise (panel D) neighbors, as viewed from the cap, that is, the two rings have opposite rotational direction of inter-subunit couplings. The distribution of different chain residues in the examined representative clusters is listed in Table I.
Figure 5
Figure 5
Regions of high broadcasting ability. (A) Residues acting as hubs lie on the peaks of maximal responsibility curve shown in gray, whereas residues shared by multiple clusters take on the job of messengers. They have high entropy values (red curve). (B) A detailed representation of the entropy curve for subunit D in the cis ring. Blue circles represent residues making at least two atom–atom contacts with the ADPs in the GroEL–GroES(ADP)7 complex. All amino acids in/near the nucleotide-binding pocket are located in this high entropy region. (C) Entropy values as a color-coded ribbon diagram. Code: red–orange–yellow–green–blue, in the order of decreasing entropy. Equatorial domains of the cis ring subunits possess the highest entropy values, whereas the cap residues are distinguished by their low entropies.
Figure 6
Figure 6
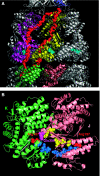
Inter- and intra-ring communication pathways. (A) Two maximum likelihood pathways (red spheres), labeled I and II, originating from residues Thr90 and Pro33 respectively, on subunit K near the nucleotide-binding site, and ending in residue Gly24 on the GroES mobile loop. The ADP molecule near subunit D is shown in cyan. (B) Maximum likelihood pathway originating from Arg197 (red) on subunit K and ending in Arg197 (red) on subunit J. The pathway is shown in yellow, achieved readily through the salt bridge Arg197–Glu386. Residue Glu386 on subunit J is shown in magenta. Also shown in blue is the pathway computed for the mutant R197A. The latter involves four additional residues in subunit K.
Figure 7
Figure 7
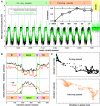
Collective dynamics and comparison with communication entropies. (A) Comparison of the experimental (black) and theoretical (green) distributions of mean-square fluctuations of residues. The theoretical curve is reconstructed from level 3 of the hierarchy. The inset shows the correlation coefficient between the theoretical B-factors derived from each level of the hierarchy (from full residue representation (c=8015) to the coarsest scale (c=21) and the experiment. Interestingly, the full residue representation (with 8015 residues) yields a correlation coefficient of 0.68 that is lower than coarse-grained representation. In particular, at level 3 (c=133), the correlation coefficient is 0.89. (B) Comparison of the communication potentials (entropies) of residues (upper panel) with their mobilities in the global mode (lower panel) for trans (orange) and cis (black) ring subunits. The communication entropies are computed using equation (5), at level L=4. Mobilities (normalized square displacements) are found from the lowest frequency GNM mode, almost identically reproduced at all levels of the hierarchy. (C) (Anti-)correlation between communication entropies and global mobilities, shown for the cis (top) and trans (bottom) ring subunits. The two sets of data yield respective correlation coefficients of 0.94 and 0.89, revealing a dual role, both mechanical stability and efficient signal propagation for a subset of residues distinguished by their restricted mobility. Also shown in panel C as blue dots are the locations of ATP-binding residues Leu31–Pro33, Asp87–Thr91, Gly415 and Asp495, exhibiting high entropies and low mobilities.

Similar articles

Cited by

References

    1. Aharoni A, Horovitz A (1996) Inter-ring communication is disrupted in the GroEL mutant Arg13 → Gly; Ala126 → Val with known crystal structure. J Mol Biol 258: 732–735 - PubMed
    1. Aharoni A, Horovitz A (1997) Detection of changes in pairwise interactions during allosteric transitions: coupling between local and global conformational changes in GroEL. Proc Natl Acad Sci 94: 1698–1702 - PMC - PubMed
    1. Atilgan AR, Durell SR, Jernigan RL, Demirel MC, Keskin O, Bahar I (2001) Anisotropy of fluctuation dynamics of proteins with an elastic network model. Biophys J 80: 505. - PMC - PubMed
    1. Bahar I, Rader AJ (2005) Coarse-grained normal mode analysis in structural biology. Curr Opin Struct Biol 15: 1–7 - PMC - PubMed
    1. Bahar I, Erman B, Monnerie L (1994) Effect of molecular structures on local chain dynamics: analytical approaches and computational methods. Adv Polym Sci 116: 151–206

Publication types