. 2006:2:37.
doi: 10.1038/msb4100076. Epub 2006 Jul 4.

Exploring the regulation of human neural precursor cell differentiation using arrays of signaling microenvironments

Affiliations

Exploring the regulation of human neural precursor cell differentiation using arrays of signaling microenvironments

Yoav Soen et al. Mol Syst Biol. 2006.

Abstract

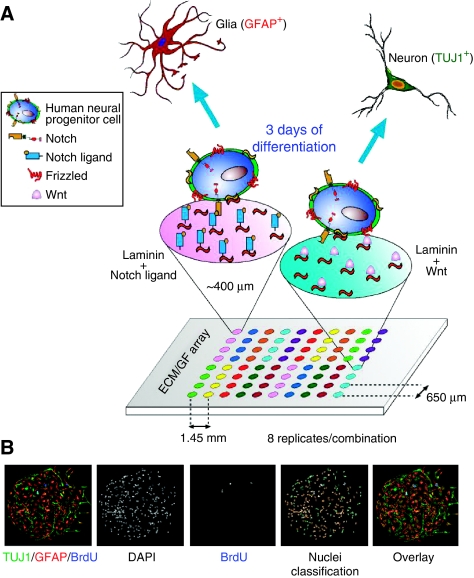
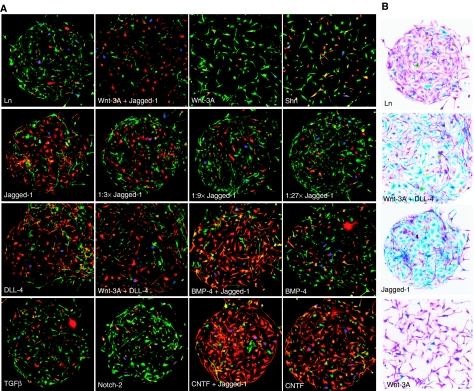
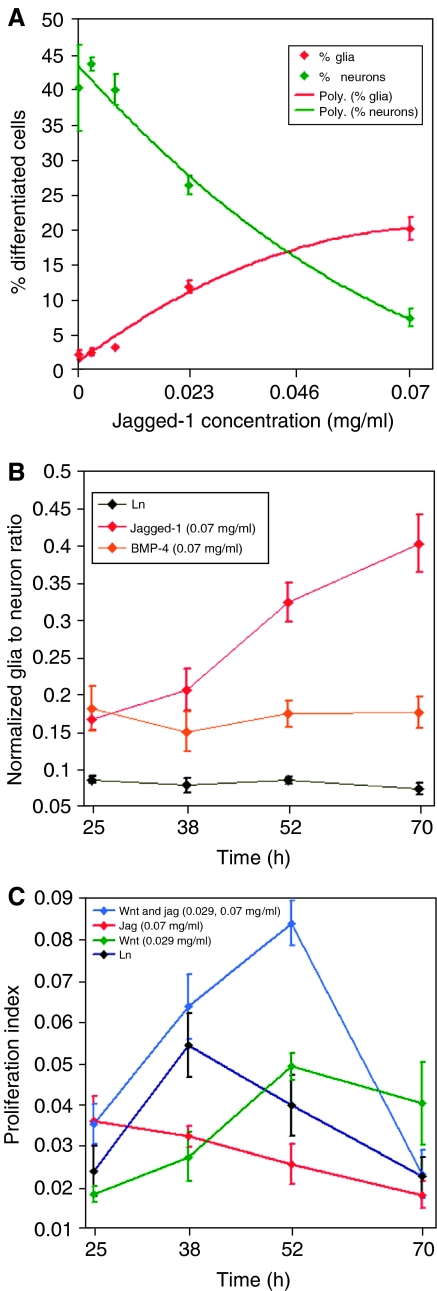
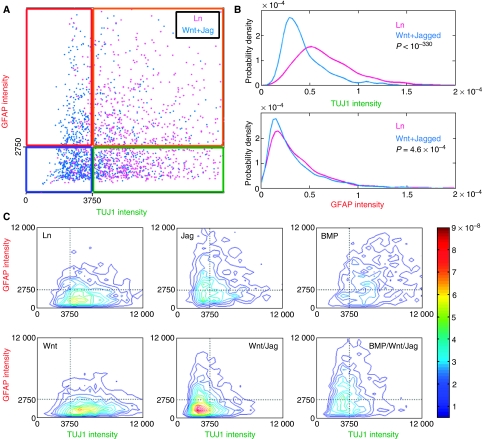
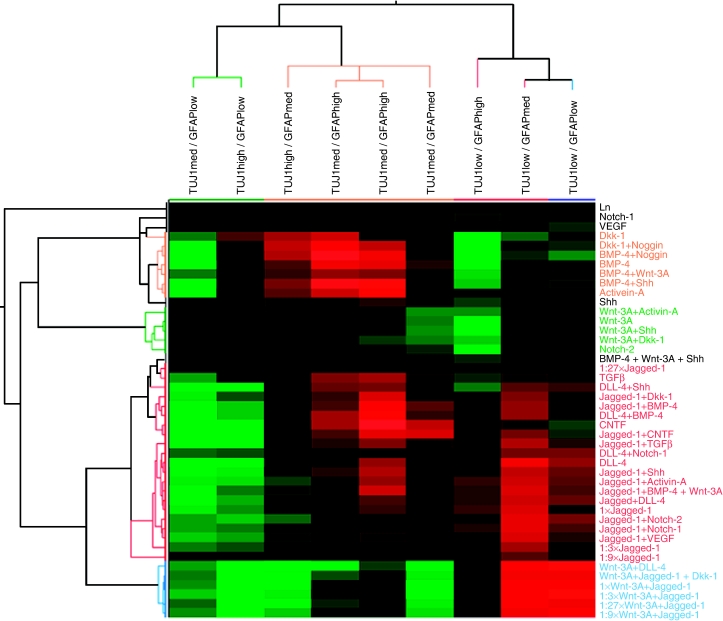
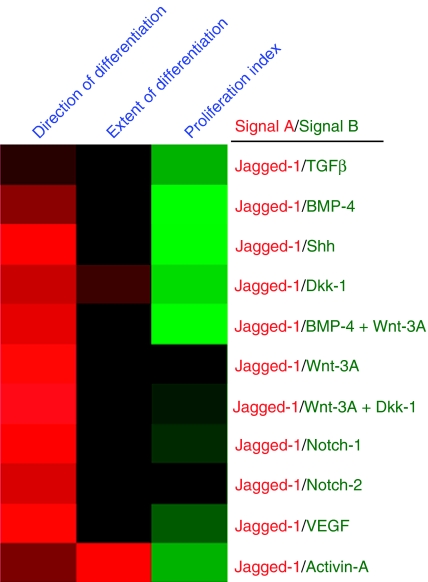
Cells of a developing embryo integrate a complex array of local and long-range signals that act in concert with cell-intrinsic determinants to influence developmental decisions. To systematically investigate the effects of molecular microenvironments on cell fate decisions, we developed an experimental method based on parallel exposure of cells to diverse combinations of extracellular signals followed by quantitative, multi-parameter analysis of cellular responses. Primary human neural precursor cells were captured and cultured on printed microenvironment arrays composed of mixtures of extracellular matrix components, morphogens, and other signaling proteins. Quantitative single cell analysis revealed striking effects of some of these signals on the extent and direction of differentiation. We found that Wnt and Notch co-stimulation could maintain the cells in an undifferentiated-like, proliferative state, whereas bone morphogenetic protein 4 induced an 'indeterminate' differentiation phenotype characterized by simultaneous expression of glial and neuronal markers. Multi-parameter analysis of responses to conflicting signals revealed interactions more complex than previously envisaged including dominance relations that may reflect a cell-intrinsic system for robust specification of responses in complex microenvironments.


Figures

Figure 1
Figure 1
(A) Schematics of a molecular microenvironment array experiment. Arrays of pre-mixed combinations of signaling molecules were printed using a non-contact, piezoelectric arrayer. Each spot typically included a combination of Ln and one or more recombinant proteins that were previously implicated in cell fate decision processes. Each combination was printed in two separate groups of four replicates. Bi-potent human neural precursors were captured onto the printed spots by adherence to the Ln. Thereafter, the cells were cultured on the array under defined, differentiation-promoting conditions for about 3 days. Differentiation and proliferation responses to each microenvironment were analyzed by immunostaining with TUJ1, GFAP, and BrdU. (B) A basic feature extraction example. Arrays were imaged with four wavelengths using automated fluorescent microscopy. Cell- and image-based information were extracted from each image using an analysis script that measured multiple phenotypes from each cell and computed ensemble average phenotypes. All the nuclei within a spot were detected using the DAPI channel and each nucleus was defined as an object representing a cell. Subsequent measurements were performed with respect to each nucleus and were associated with the corresponding cell. Perinuclear cytoplasmic region was defined by expanding a narrow ring of specified width (0.55 μm) around each nucleus. Cell fate and extent of differentiation were evaluated by measuring TUJ1 and GFAP intensities within the perinuclear ring. Proliferating cells were identified based on intranuclear BrdU threshold crossing. Green and orange circles indicate non-proliferating neuron-like and glial-like cells, respectively (right panel). Blue and white circles correspond, respectively, to proliferating neuron-like and glial-like cells.
Figure 2
Figure 2
Microenvironment-dependent differentiation and morphology. Human neural precursors were captured and cultured on a printed Ln/ligand array for 70 h under differentiation-promoting conditions. Following the differentiation period, the cells were fixed and counterstained with GFAP (red), BrdU (blue), TUJ1 (green), and DAPI (not shown). (A) A small portion of the array with 16 different microenvironments each containing a few hundred cells. The balance between TUJ1 and GFAP staining on the reference Ln spot (top left) was skewed toward preferential expression of the neuronal marker TUJ1. This balance was shifted in a spot-dependent manner by some of the signal-containing spots. In particular, spots containing CNTF (bottom right) and Notch ligands (right panels on the 2nd and 3rd rows) led to a dramatic shift toward increased GFAP proportions, suggesting a gliogenic response to Notch stimulation. Dilution series of Jagged-1 (2nd row panels) revealed dose-dependent response to Notch stimulation. Combination of some gliogenic signals (e.g. Jagged-1 and CNTF) led to further increase in the gliogenic response. A smaller shift toward increased neuronal proportions was observed on Wnt-3A spots. (B) Color inverted images demonstrating spot-dependent morphological differences. Cells that were exposed to a combination of Wnt-3A and a Notch ligand (second spot from the top) exhibited longer and more elaborated processes compared to Ln alone (top). Typical spot diameter was 400 μm. Fields of view in all panels are identical in size. Wnt-3A-containing spots consistently larger.
Figure 3
Figure 3
Dose response (A) and kinetic measurements (B, C) on the array. (A) Percentiles of differentiated neuron-like cells (green) and glial-like cells (red), as a function of spotted Jagged-1 concentration. The higher the concentration of the Notch ligand, the higher or lower the percentage, respectively, of differentiating glial-like and neuron-like cells. Red and green lines represent polynomial fits. Error bars represent standard errors computed using spot replicates on the same array. (B) Differential kinetics of gliogenic responses. Shown are four time points from a time-course experiment conducted in parallel with four arrays that were cultured for 25, 38, 52, and 70 h. Exposure to BMP-4 (orange) and Jagged-1 (red) increased the relative proportions of glia as compared to Ln (black). The BMP-4 response was already at a plateau after 25 h, whereas the response to Jagged-1 stimulation occurred over a significantly longer timescale. (C) Differential kinetics of proliferation. Traces of proliferation index in the same time-course experiment revealed dynamic, spot-dependent differences in proliferation responses. Integration over all four time points revealed that co-exposure to Wnt-3A and Jagged-1 (light blue) or DLL-4 (not shown) led to a significant increase in proliferation.
Figure 4
Figure 4
Analysis of differentiation in single cells. (A) TUJ1 and GFAP intensities recorded from individual cells were represented by a coordinate in a ‘differentiation plane' whose axis was defined by these intensities. The TUJ1-GFAP plane was divided into neural-like (green rectangle), glial-like (red rectangle), undifferentiated-like (blue rectangle), and indeterminate differentiation (orange rectangle). Measurements from all the cells that were exposed to the same signaling combination yielded a distribution that was characteristic to that combination. Shown are two such distributions corresponding to Ln (purple) and Wnt-3A/Jagged-1 (light blue) stimulation. The Wnt-3A/Jagged-1 distribution was shifted toward lower revels of TUJ1 staining intensity, resulting in a marked elevation in the fraction of undifferentiated-like cells (blue rectangle). (B) Individual TUJ1 (top) and GFAP (bottom) probability density functions, demonstrating the decrease in TUJ1 intensity values in response to co-exposure to Wnt-3A and Jagged-1. (C) Contour plots of the estimated two-dimensional probability density of cells for various stimuli. Note the strong Wnt-3A/Jagged-1-mediated increase in the proportions of undifferentiated-like cells (bottom center) compared to Ln (top left).
Figure 5
Figure 5
A color-coded map connecting external stimulation (in rows) to differentiation-related phenotypes (columns). Columns display relative fractions of cells measured in each of nine regions of the TUJ1-GFAP ‘differentiation plane' representing low, medium, and high staining intensity for each marker. Each row corresponds to a particular signaling microenvironment. Ensemble average fractions of cells were measured in two array experiments, averaged across experiments, and normalized by the corresponding values on spots containing Ln alone. Normalized values were log-transformed and each column was scaled to a unit standard deviation. Red and green colors represent higher and lower than Ln values, respectively. Rows and columns were clustered using Pearson correlation as a similarity metric. Signaling combinations that induced a similar TUJ1-GFAP distribution profile were clustered together, resulting in four main groups of influence: (i) gliogenic-like (red-labeled), (ii) neurogenic-like (green), (iii), undifferentiated-like (light blue), and (iv) indeterminate differentiation (orange).
Figure 6
Figure 6
Evaluation of dominance relations between Jagged-1 and other signaling environments with respect to differentiation- and proliferation-related phenotypes. Each row corresponds to a specific signaling pair containing Jagged-1 as one of the signals. Each column denotes a specific phenotype. Direction of differentiation refers to the ratio of GFAP to TUJ1 staining. Extent of differentiation represents the intensity of lineage marker staining, and proliferation index indicates the fraction of BrdU-positive cells. Dominance over a particular phenotype was evaluated based on the difference between the responses to the individual signals and the response to the combined signals. Dominance scores are displayed in a color code with red pixels designating dominance of the response to Jagged-1 and green corresponding to dominance of the response to the other signal (or a combination of signals). The brighter the color, the stronger the dominance. Note the dominance of Jagged-1 response with respect to the direction of differentiation (left column) and the inverse relation with respect to the proliferation index (right column).

Comment in

Similar articles

Cited by

References

    1. Al-Hajj M, Wicha MS, Benito-Hernandez A, Morrison SJ, Clarke MF (2003) Prospective identification of tumorigenic breast cancer cells. Proc Natl Acad Sci USA 100: 3983–3988 - PMC - PubMed
    1. Anderson DG, Levenberg S, Langer R (2004) Nanoliter-scale synthesis of arrayed biomaterials and application to human embryonic stem cells. Nat Biotechnol 22: 863–866 - PubMed
    1. Anderson DJ (2001) Stem cells and pattern formation in the nervous system: the possible versus the actual. Neuron 30: 19–35 - PubMed
    1. Bailey SN, Sabatini DM, Stockwell BR (2004) Microarrays of small molecules embedded in biodegradable polymers for use in mammalian cell-based screens. Proc Natl Acad Sci USA 101: 16144–16149 - PMC - PubMed
    1. Bertrand N, Castro DS, Guillemont F (2002) Proneural genes and the specification of neuronal cell types. Nat Rev Neurosci 3: 517–530 - PubMed

Publication types

MeSH terms