

Adaptive virus detection using filament-coupled antibodies
- PMID: 16822062
- PMCID: PMC1828279
- DOI: 10.1117/1.2209907
Adaptive virus detection using filament-coupled antibodies
Abstract
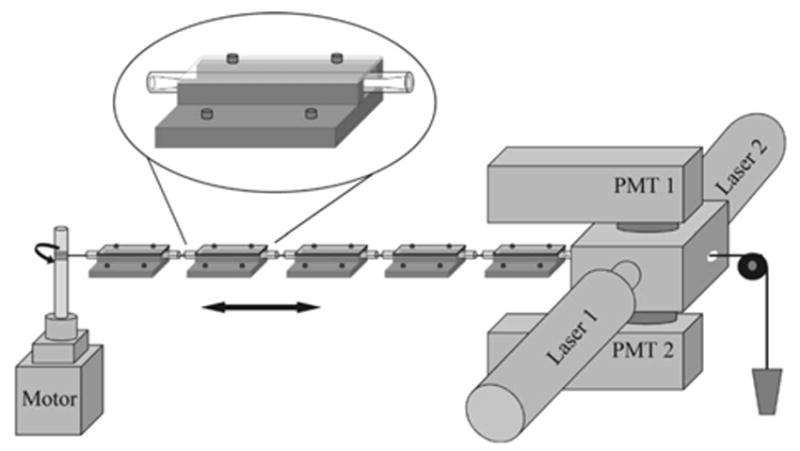
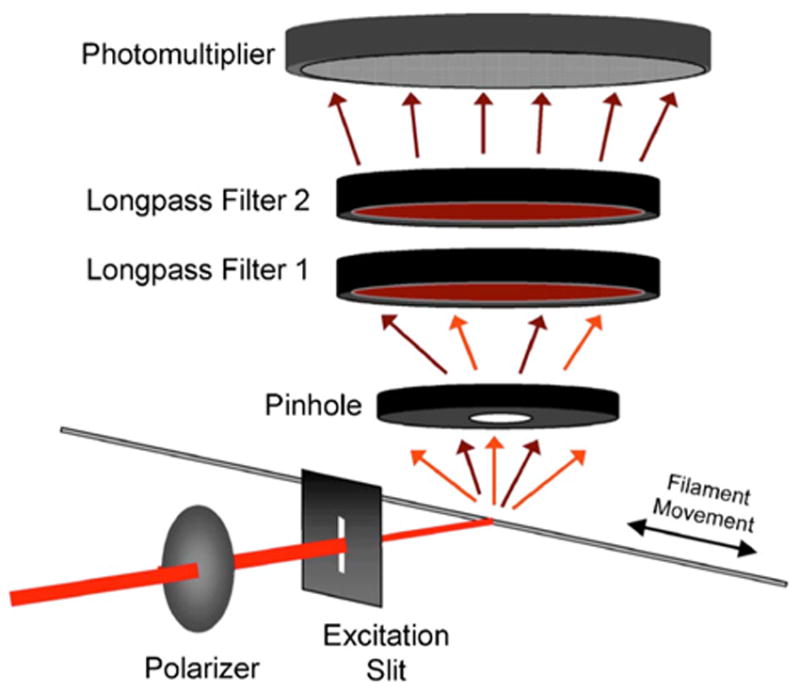
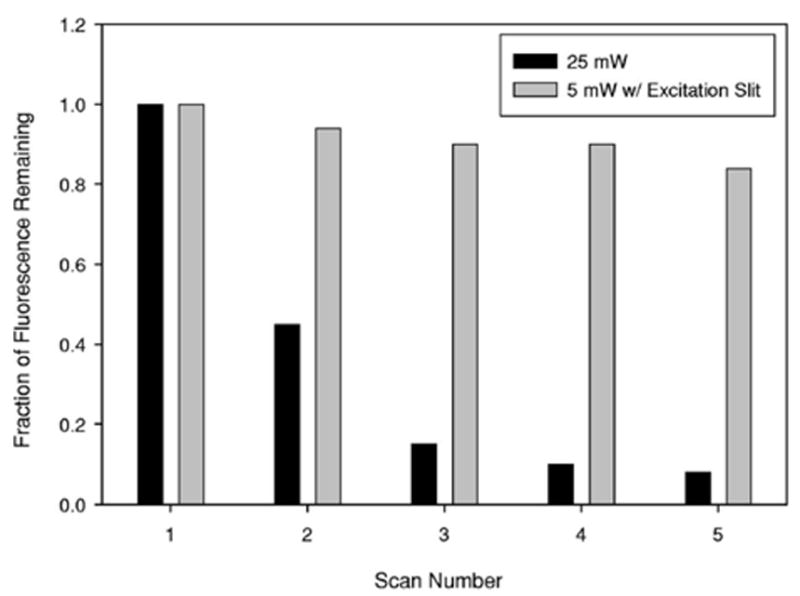
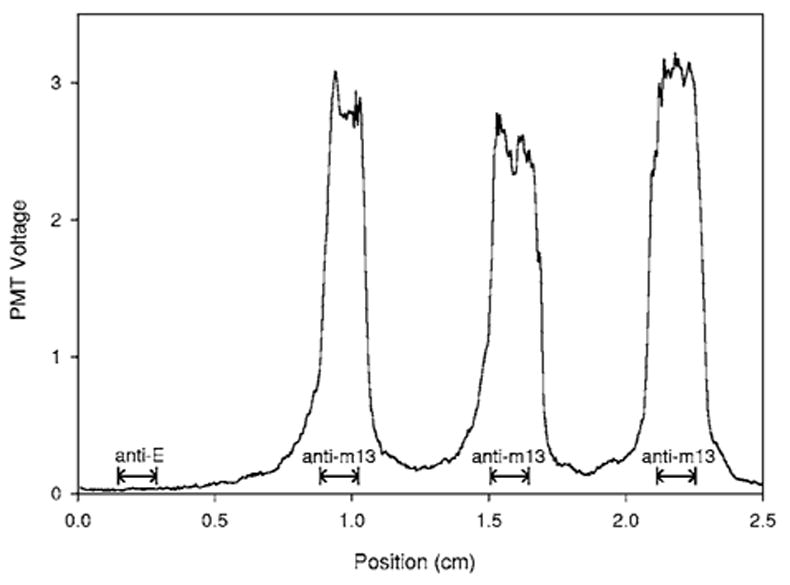
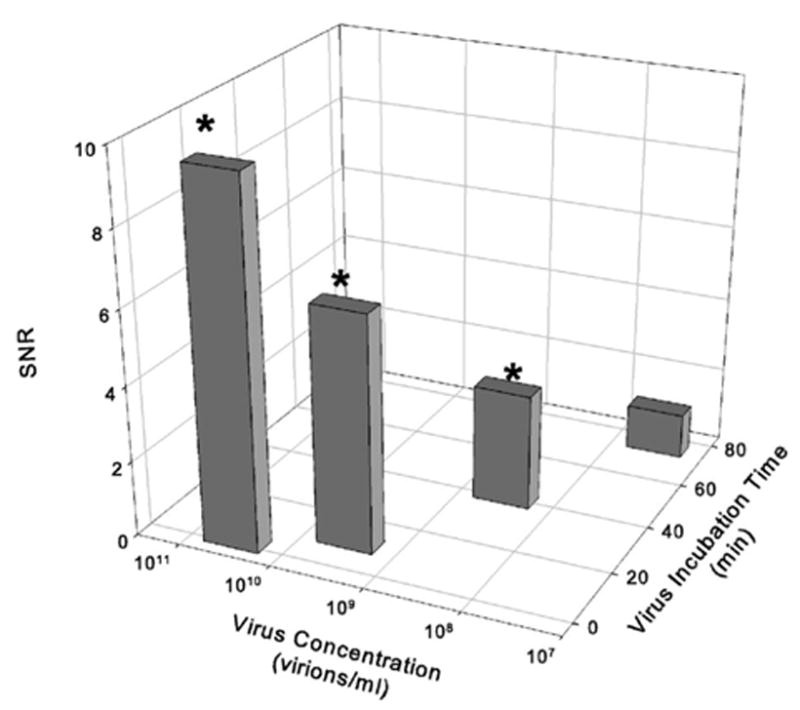
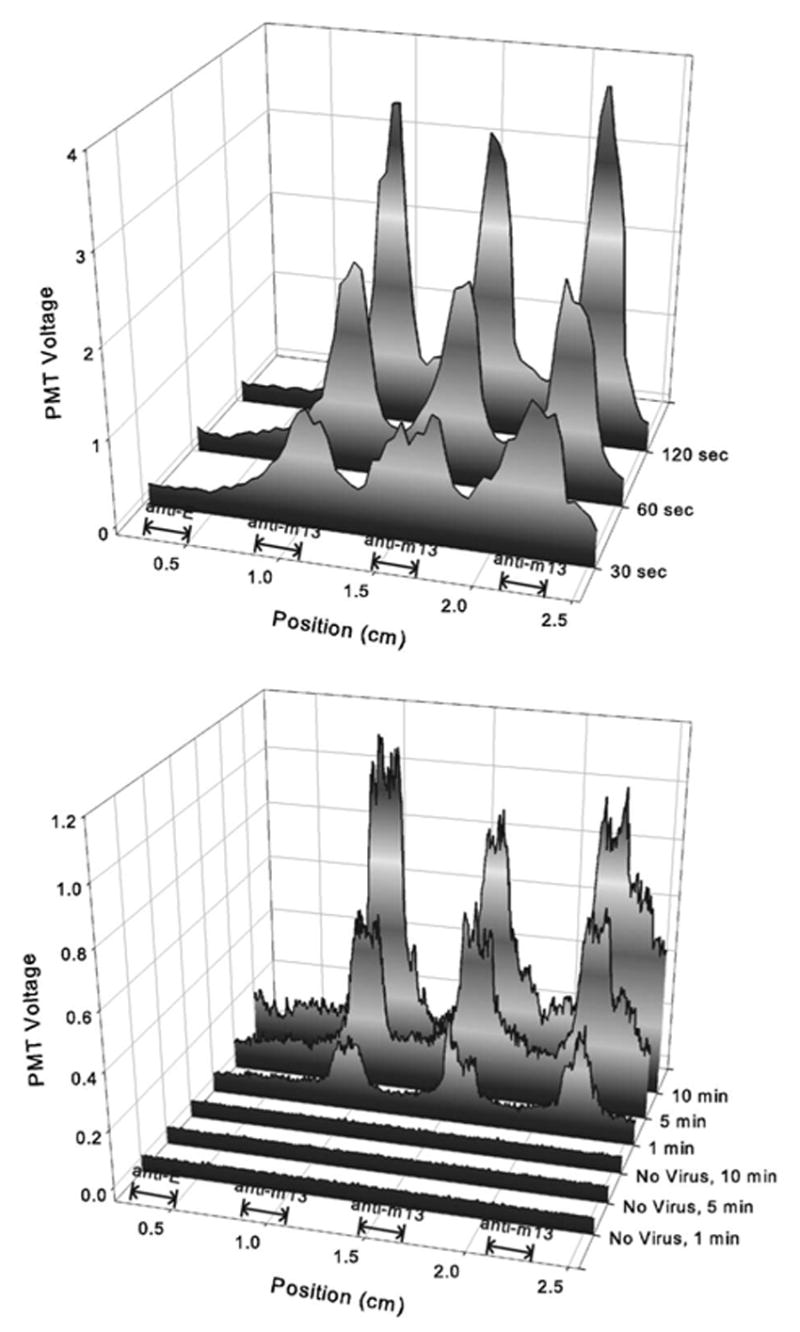
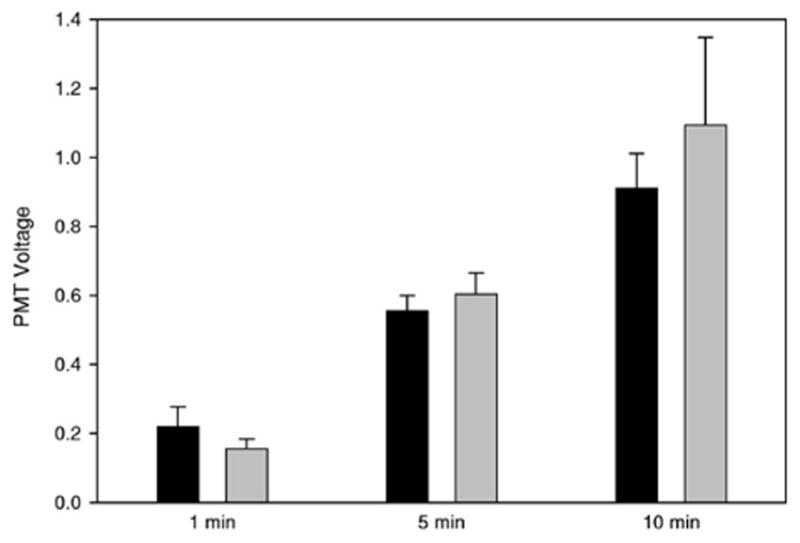
We recently reported the development of a filament-antibody recognition assay (FARA), in which the presence of virions in solution initiates the formation of enzyme-linked immunosorbent assay (ELISA)-like antibody complexes. The unique features of this assay are that processing is achieved by motion of a filament and that, in the presence of a virus, antibody-virus complexes are coupled to the filament at known locations. In this work, we combine the unique features of this assay with a 638-nm laser-based optical detector to enable adaptive control of virus detection. Integration of on-line fluorescence detection yields approximately a five-fold increase in signal-to-noise ratio (SNR) compared to the fluorescence detection method reported previously. A one-minute incubation with an M13K07 test virus is required to detect 10(10) virionsml, and 40 min was required to detect 10(8) virionsml. In tests of the components of an adaptive strategy, a 30-min virus (3.3 x 10(10) virionsml) incubation time, followed by repositioning the filament-captured virus either within the detecting antibody chamber, (20 microg ml) or within the virus chamber, found an increase in signal roughly proportional to the cumulative residence times in these chambers. Furthermore, cumulative fluorescence signals observed for a filament-captured virus after repeated positioning of the filament within the virus chamber are similar to those observed for a single long incubation time. The unique features of the FARA-like design combined with online optical detection to direct subsequent bioprocessing steps provides new flexibility for developing adaptive molecular recognition assays.
Figures
References
-
- Iqbal SS, Mayo MW, Bruno JG, Bronk BV, Batt CA, Chambers JP. A review of molecular recognition technologies for detection of biological threat agents. Biosens Bioelectron. 2000;15(11–12):549–578. - PubMed
-
- Peruski LF, Jr, Peruski AH. Rapid diagnostic assays in the genomic biology era: detection and identification of infectious disease and biological weapon agents. BioTechniques. 2003;35(4):840–846. - PubMed
-
- Andreotti PE, Ludwig GV, Peruski AH, Tuite JJ, Morse SS, Peruski LF., Jr Immunoassay of infectious agents. BioTechniques. 2003;35(4):850–859. - PubMed
-
- Marazuela MD, Moreno-Bondi MC. Fiber-optic biosensors—an overview. Anal Bioanal Chem. 2002;372(5–6):664–682. - PubMed
-
- D’Orazio P. Biosensors in clinical chemistry. Clin Chim Acta. 2003;334(1–2):41–69. - PubMed
