. 2006 Jul;209(1):93-110.
doi: 10.1111/j.1469-7580.2006.00581.x.

Reconstructing impairment of secretory ameloblast function in porcine teeth by analysis of morphological alterations in dental enamel

Affiliations

Reconstructing impairment of secretory ameloblast function in porcine teeth by analysis of morphological alterations in dental enamel

Carsten Witzel et al. J Anat. 2006 Jul.

Abstract

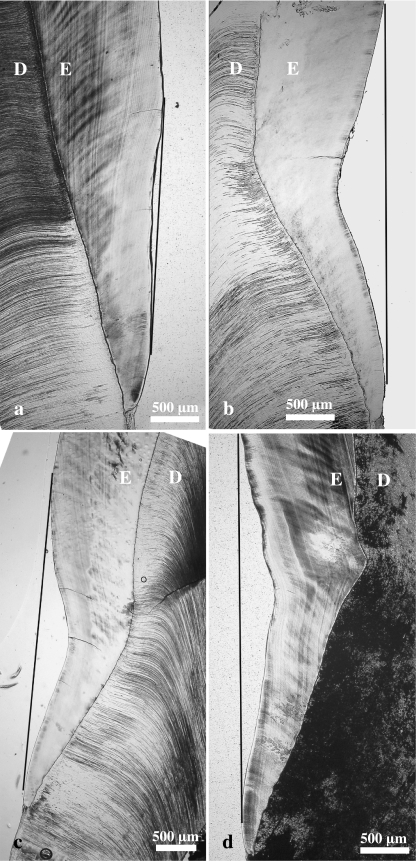
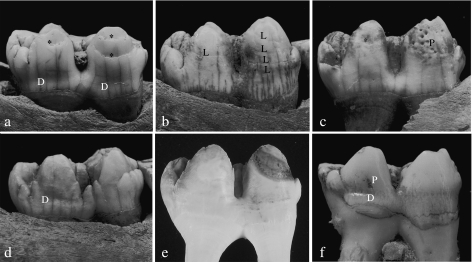
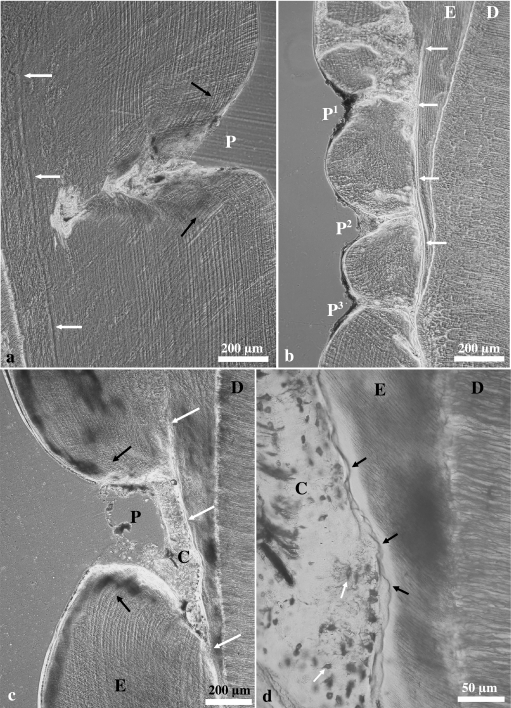
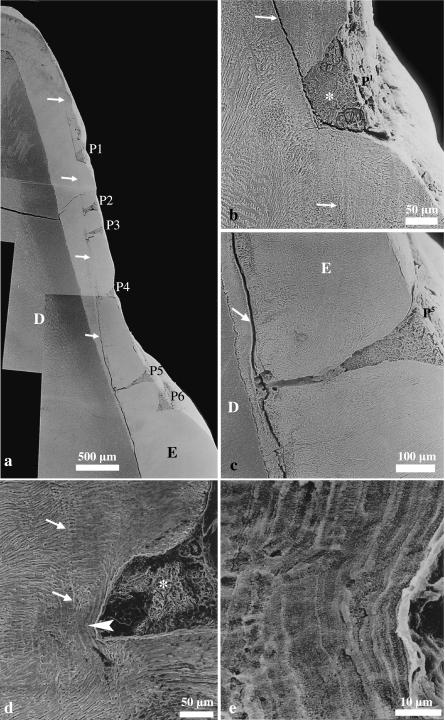
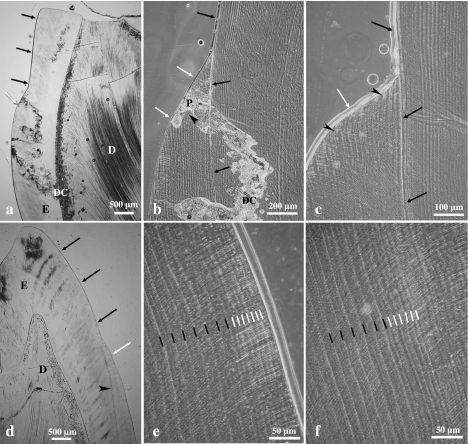
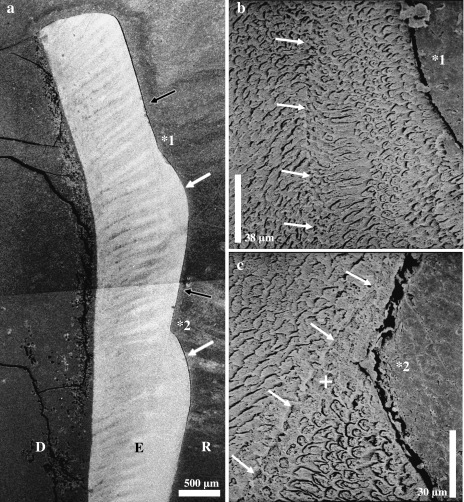
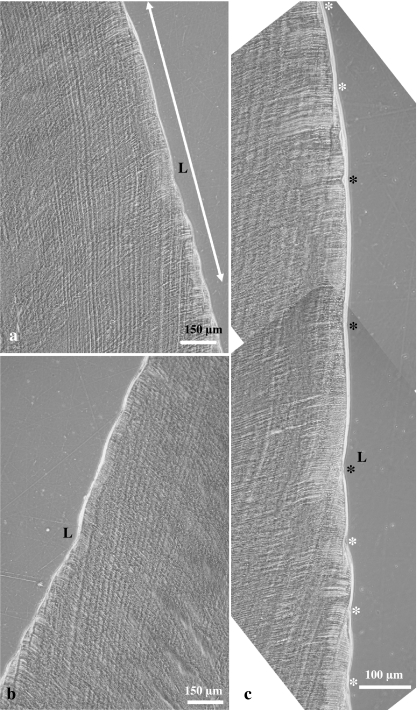
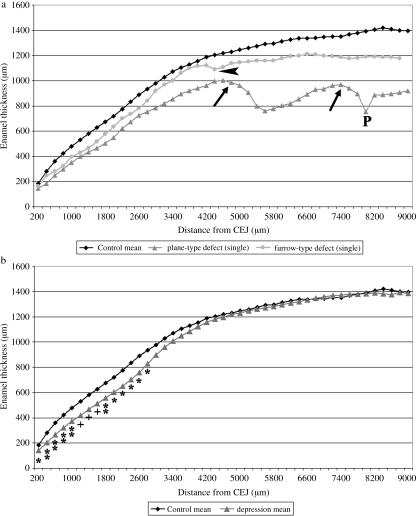
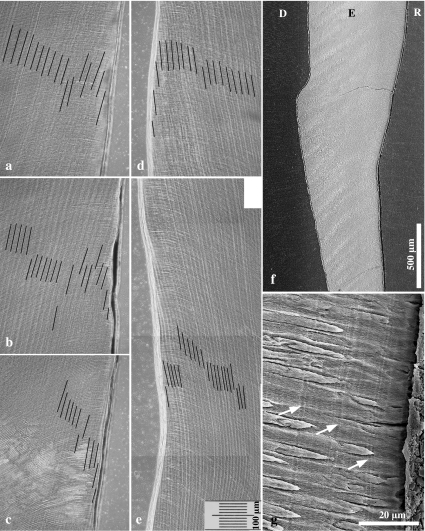
We studied the relationship between the macroscopic appearance of hypoplastic defects in the dental enamel of wild boar and domestic pigs, and microstructural enamel changes, at both the light and the scanning electron microscopic levels. Deviations from normal enamel microstructure were used to reconstruct the functional and related morphological changes of the secretory ameloblasts caused by the action of stress factors during amelogenesis. The deduced reaction pattern of the secretory ameloblasts can be grouped in a sequence of increasingly severe impairments of cell function. The reactions ranged from a slight enhancement of the periodicity of enamel matrix secretion, over a temporary reduction in the amount of secreted enamel matrix, with reduction of the distal portion of the Tomes' process, to either a temporary or a definite cessation of matrix formation. The results demonstrate that analysis of structural changes in dental enamel allows a detailed reconstruction of the reaction of secretory ameloblasts to stress events, enabling an assessment of duration and intensity of these events. Analysing the deviations from normal enamel microstructure provides a deeper insight into the cellular changes underlying the formation of hypoplastic enamel defects than can be achieved by mere inspection of tooth surface characteristics alone.


Figures

Fig. 7
Fig. 7
Light micrographs (bright-field microscopy) of longitudinal ground sections through lingual enamel of the distal half of M2 from wild boar (a,b) and domestic pigs (c,d). (a) Control molar exhibiting a very slight concavity in the cervical enamel surface. The shortest distance between the deepest point of the concavity of the enamel surface and the tangential line connecting the cuspally and cervically adjacing enamel surfaces is 65 µm. (b–d) Molars exhibiting depression-type defects. Note distinct concavity of both the cervical enamel surface and the course of the DEJ. Maximum depression depth is 491 µm in (b), 388 µm in (c) and 373 µm in (d). D = dentine, E = enamel.
Fig. 1
Fig. 1
Left (a–c) and right (d) M2 of domestic pigs and left M2 of wild boar (e,f) in lingual (a–c,e,f) or buccal (d) view. Different types of hypoplastic enamel defects are shown in a–d and f; e: control tooth. D = depression-type defects, L = linear (furrow-type) defects, P = pit-type defects, * = plane-type defects. Magnification approximately 2.5×.
Fig. 2
Fig. 2
Light micrographs of pit-type enamel defects. (a) Domestic pig, left M2; longitudinal ground section through mesial tooth half, lingual enamel (phase contrast microscopy). Pit-type defect, note bending of the striae of Retzius in the enamel forming the wall of the defect (black arrows) and a pathological incremental band (white arrows) that is associated with the pit (P). (b) Wild boar, left M1; longitudinal ground section through distal tooth half, lingual enamel (phase contrast microscopy). Three distinct hypoplastic pits (P1–3) originate at a pathological incremental band (white arrows). D = dentine, E = enamel. (c) Domestic pig, right M2; longitudinal ground section through distal tooth half, lingual enamel (phase contrast microscopy). Large hypoplastic pit (P) in the enamel (E). The bottom of the defect is filled with cellular cementum (C). Note bending of the striae of Retzius (black arrows) in the enamel forming the wall of the defect. A pathological incremental band that is continuous with the enamel surface in the defect area can be seen (white arrows). D = dentine. (d) Higher magnification of the bottom area of the pit-type defect shown in (c) (bright-field microscopy). Note scalloped outline (black arrows) of the enamel (E) surface beneath the plug of cellular cementum (C) that contains numerous cementocyte lacunae (white arrows) with radiating canaliculi. D = dentine.
Fig. 3
Fig. 3
Scanning electron micrographs of etched longitudinal sections through wild boar teeth. (a) Right P2, buccal enamel. Row of pit-type hypoplastic enamel defects (P1–6) originating at a pathological incremental band (white arrows) that appears cleft-like. Defect P6 has been sectioned tangentially. D = dentine, E = enamel. (b) Higher magnification of the most cuspally located pit-type defect (P1) that is occluded by dental calculus (asterisk). Note pathological incremental band (white arrows) that is continuous with the bottom of the pit. (c) Higher magnification of pit P5, which extends deep into the enamel (E) and has a funnel-shaped sectional outline. The defect, which is partly filled by dental calculus, originates at a pathological incremental band (white arrow) that appears cleft-like. D = dentine. (d) Left I2, labial enamel. Aprismatic enamel (arrowhead) beneath the base of a small pit-type hypoplastic defect that is filled with dental calculus (asterisk). A slightly accentuated incremental line is marked by arrows. (e) Higher magnification of aprismatic enamel beneath the bottom of the hypoplastic defect shown in (d). Note layered appearance of the aprismatic enamel.
Fig. 4
Fig. 4
Light micrographs of plane-type hypoplastic defects in the enamel of the left M2 of domestic pigs, longitudinal ground sections; bright-field microscopy (a,d) or phase contrast microscopy (b,c,e,f). (a) Extended plane-type defect (black arrows). Ledge area (white arrow) located between the defect and the cervically adjacent enamel. D = dentine, DC = area exhibiting diagenetic changes, E = enamel. (b) Higher magnification of the ledge area shown in (a). A pathological incremental band (middle and lower black arrows), which is continuous with the enamel surface of the defect area (upper black arrow), is present in the enamel cervical to the defect. A single pit-type defect (P) is present in the ledge area (white arrows). Note bending of the striae of Retzius (arrowhead) according to the outline of the pit. DC = area exhibiting diagenetic changes. (c) Ledge area (white arrow) located cervical to a plane-type defect (upper black arrow) that is continuous with a pathological incremental band (middle and lower black arrows). Note bending of the striae of Retzius in the outer enamel of the ledge area (arrowheads). (d) Shallow plane-type defect (black arrows) cuspal to a less pronounced ledge (white arrow). A group of narrow spaced striae of Retzius (arrowhead) can be seen in the enamel cervical to the ledge. D = dentine, E = enamel. (e) Higher magnification of the enamel surface of the hypoplastic defect near the ledge area shown in (d). A group of narrow spaced striae of Retzius (marked in white) is visible in the enamel directly beneath the enamel surface. The striae of Retzius located deeper in the enamel (marked in black) show a normal spacing. (f) Higher magnification of the enamel located cervical to the defect area. The group of narrow spaced striae of Retzius (marked in white) is located deeper within the enamel. Normally spaced striae of Retzius internal to this band are marked in black.
Fig. 5
Fig. 5
Scanning electron micrographs of etched longitudinal sections through lingual enamel of the left M2 of a domestic pig. (a) Two plane-type defects (black arrows) can be seen. Distinct ledges (white arrows) are present cervical to these defects. Note the more obtuse angle between the exposed incremental plane and the ledge in the cuspal (*1) compared with the cervical (*2) defect. D = dentine, E = enamel, R = resin. (b) Higher magnification of the defect marked by *1 in (a). White arrows point to a pathological incremental band. (c) Higher magnification of the defect marked by *2 in (a) and the associated pathological incremental band. Note sharp demarcation of this band (white arrows) against the enamel located internal to it and zone of aprismatic enamel (+) intercalated between the demarcation line and the prismatic enamel located further peripherally.
Fig. 6
Fig. 6
Light micrographs (phase contrast microscopy) of a longitudinal ground section through a left M2 of a domestic pig. (a) Linear hypoplastic defect (L) in lingual enamel. The double headed arrow denotes the area magnified in (c). (b) Corresponding linear defect (L) in buccal enamel. (c) Higher magnification of the area marked in (a). Perikyma grooves are marked by asterisks. Note increased distance between three neighbouring perikyma grooves (black asterisks) in the occlusal wall of the defect. White asterisk: normally spaced perikyma grooves.
Fig. 9
Fig. 9
Results of enamel thickness measurements. (a) Comparison of lingual enamel thickness in control M2 (mean of eight specimens, upper curve), in a single M2 exhibiting a furrow-type defect (LEH, middle curve) and in another M2 showing two plane-type hypoplastic defects (lower curve). Note grossly reduced thickness of cuspal enamel in the tooth exhibiting the two plane-type defects. Ledges located cervical to these defects are marked by black arrows. The two defects are shown in Figs 1(a) and 5(a). P = pit-type defect located in ledge area. In the tooth exhibiting LEH, the arrowhead indicates the furrow marked by ‘L’ in Fig. 6(c). (b) Comparison of enamel thickness between control M2 (n = 8) and M2 (n = 7) classified as exhibiting depression-type defects. Significant differences of enamel thickness at corresponding distances from the CEJ are marked (*P < 0.05, **P < 0.01, Student's t-test; +P < 0.05, Mann–Whitney U-test).
Fig. 8
Fig. 8
Light and scanning electron micrographs of longitudinal sections through porcine molar enamel. (a–e) Light micrographs (phase contrast microscopy) of ground sections through lingual enamel of the distal half of M2 from a wild boar (a–c) without depression-type defect and a domestic pig (d,e) exhibiting a depression-type defect. Mean distances between neighbouring striae of Retzius (marked in black) in the control molar were c. 24 µm in cuspal (a), c. 19 µm in mid-crown (b), and c. 16 µm in cervical enamel (c). In the M2 with a depression-type defect, the distances between neighbouring striae of Retzius (marked in black) were c. 20 µm in cuspal enamel adjacent to the depression area (d) and c. 12 µm in the surface enamel at the deepest point of the depression (e). (f,g) Scanning electron micrographs of etched longitudinal sections through the lingual enamel of a domestic pig M2 exhibiting a depression-type defect. (f) No marked disturbance of enamel microstructure is discernible in the depression area. D = dentine, E = enamel, R = resin. (g) Higher magnification of the surface enamel at the deepest point of the depression depicted in (f). Note slight accentuation of the striae of Retzius (arrows) and of shorter-period incremental markings in both enamel prisms and interprismatic/aprismatic enamel.

Similar articles

Cited by

References

    1. Berten J. Hypoplasien des Schmelzes (Congenitale Schmelzdefecte; Erosionen) Dt Mschr Zahnheilk. 1895;13:425–439. 483–498, 533–548, 587–600.
    1. Boyde A. The development of enamel structure. Proc Roy Soc Med. 1967;60:923–928. - PMC - PubMed
    1. Boyde A. The surface of the enamel in human hypoplastic teeth. Arch Oral Biol. 1970;15:897–898. - PubMed
    1. Boyde A. Enamel. In: Oksche A, Vollrath L, editors. Handbook of Microscopic Anatomy V/6 Teeth. Heidelberg: Springer; 1989. pp. 309–473.
    1. Boyde A. Microstructure of enamel. In: Chadwick D, Cardew G, editors. Dental Enamel. Ciba Foundation Symposium 205. Chichester: Wiley; 1997. pp. 18–31. - PubMed

Publication types

LinkOut - more resources