Characterization of pancreatic lesions from MT-tgf alpha, Ela-myc and MT-tgf alpha/Ela-myc single and double transgenic mice
- PMID: 16822304
- PMCID: PMC1559682
- DOI: 10.1186/1477-3163-5-19
Characterization of pancreatic lesions from MT-tgf alpha, Ela-myc and MT-tgf alpha/Ela-myc single and double transgenic mice
Abstract
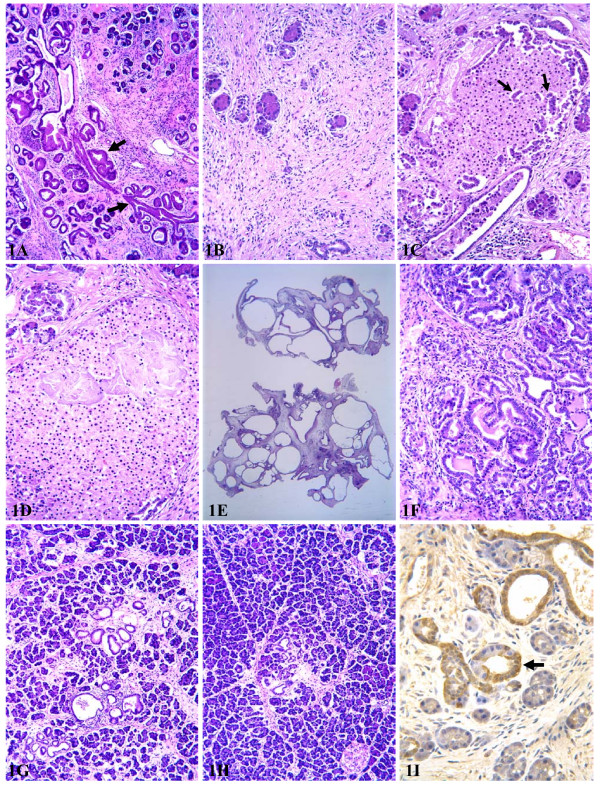
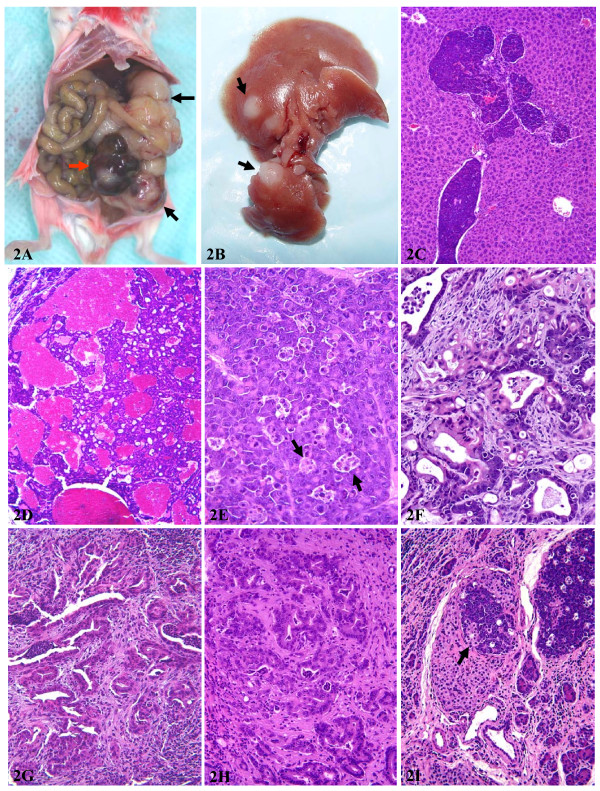
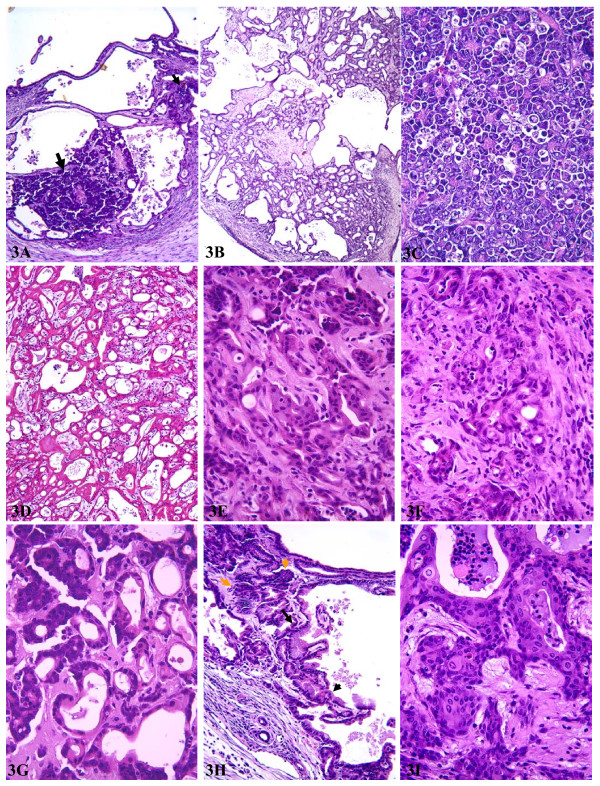
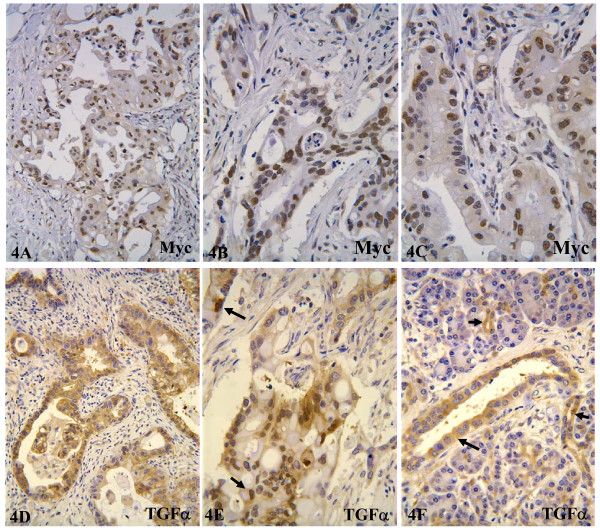
In order to identify good animal models for investigating therapeutic and preventive strategies for pancreatic cancer, we analyzed pancreatic lesions from several transgenic models and made a series of novel findings. Female MT-tgf alpha mice of the MT100 line developed pancreatic proliferation, acinar-ductal metaplasia, multilocular cystic neoplasms, ductal adenocarcinomas and prominent fibrosis, while the lesions in males were less severe. MT-tgf alpha-ES transgenic lines of both sexes developed slowly progressing lesions that were similar to what was seen in MT100 males. In both MT100 and MT-tgf alpha-ES lines, TGF alpha transgene was expressed mainly in proliferating ductal cells. Ela-myc transgenic mice with a mixed C57BL/6, SJL and FVB genetic background developed pancreatic tumors at 2-7 months of age, and half of the tumors were ductal adenocarcinomas, similar to what was reported originally by Sandgren et al 1. However, in 20% of the mice, the tumors metastasized to the liver. MT100/Ela-myc and MT-tgf alpha-ES/Ela-myc double transgenic mice developed not only acinar carcinomas and mixed carcinomas as previously reported but also various ductal-originated lesions, including multilocular cystic neoplasms and ductal adenocarcinomas. The double transgenic tumors were more malignant and metastasized to the liver at a higher frequency (33%) compared with the Ela-myc tumors. Sequencing of the coding region of p16ink4, k-ras and Rb cDNA in small numbers of pancreatic tumors did not identify mutations. The short latency for tumor development, the variety of tumor morphology and the liver metastases seen in Ela-myc and MT-tgf alpha/Ela-myc mice make these animals good models for investigating new therapeutic and preventive strategies for pancreatic cancer.
Figures
Similar articles
-
Acinar-to-ductal metaplasia accompanies c-myc-induced exocrine pancreatic cancer progression in transgenic rodents.Int J Cancer. 2012 Sep 1;131(5):1243-8. doi: 10.1002/ijc.27322. Epub 2012 Jan 11. Int J Cancer. 2012. PMID: 22024988
-
Pancreatic carcinomas of acinar and mixed acinar/ductal phenotypes in Ela-1-myc transgenic mice do not contain c-K-ras mutations.Am J Pathol. 1994 Sep;145(3):696-701. Am J Pathol. 1994. PMID: 8080049 Free PMC article.
-
Molecular analyses of liver tumors in c-myc transgenic mice and c-myc and TGF-alpha double transgenic mice.Cancer Lett. 1996 Aug 23;106(1):43-9. doi: 10.1016/0304-3835(96)04299-1. Cancer Lett. 1996. PMID: 8827045
-
TGF beta regulation of cell proliferation.Princess Takamatsu Symp. 1994;24:250-63. Princess Takamatsu Symp. 1994. PMID: 8983080 Review.
-
Molecular mechanisms of hepatocarcinogenesis in transgenic mouse models of liver cancer.Toxicol Pathol. 2005;33(1):181-4. doi: 10.1080/01926230590522095. Toxicol Pathol. 2005. PMID: 15805070 Review.
Cited by
-
Reviewing once more the c-myc and Ras collaboration: converging at the cyclin D1-CDK4 complex and challenging basic concepts of cancer biology.Cell Cycle. 2011 Jan 1;10(1):57-67. doi: 10.4161/cc.10.1.14449. Epub 2011 Jan 1. Cell Cycle. 2011. PMID: 21200143 Free PMC article. Review.
-
Mutation or not, what directly establishes a neoplastic state, namely cellular immortality and autonomy, still remains unknown and should be prioritized in our research.J Cancer. 2022 Jul 4;13(9):2810-2843. doi: 10.7150/jca.72628. eCollection 2022. J Cancer. 2022. PMID: 35912015 Free PMC article. Review.
-
Weaknesses and Pitfalls of Using Mice and Rats in Cancer Chemoprevention Studies.J Cancer. 2015 Sep 1;6(10):1058-65. doi: 10.7150/jca.12519. eCollection 2015. J Cancer. 2015. PMID: 26366220 Free PMC article. Review.
-
Challenges and advances in mouse modeling for human pancreatic tumorigenesis and metastasis.Cancer Metastasis Rev. 2013 Jun;32(1-2):83-107. doi: 10.1007/s10555-012-9408-2. Cancer Metastasis Rev. 2013. PMID: 23114842 Free PMC article. Review.
-
Basic anatomy and tumor biology of the RPS6KA6 gene that encodes the p90 ribosomal S6 kinase-4.Oncogene. 2013 Apr 4;32(14):1794-810. doi: 10.1038/onc.2012.200. Epub 2012 May 21. Oncogene. 2013. PMID: 22614021 Free PMC article.
References
-
- Cubilla AL, Fitzgerald PJ. Classification of pancreatic cancer (nonendocrine) Mayo Clin Proc. 1979;54:449–458. - PubMed
Grants and funding
LinkOut - more resources
Full Text Sources
Molecular Biology Databases
Miscellaneous