. 2006 Jul 5;26(27):7201-11.
doi: 10.1523/JNEUROSCI.5230-05.2006.

Scotopic visual signaling in the mouse retina is modulated by high-affinity plasma membrane calcium extrusion

Affiliations

Scotopic visual signaling in the mouse retina is modulated by high-affinity plasma membrane calcium extrusion

Jacque L Duncan et al. J Neurosci. .

Abstract

Transmission of visual signals at the first retinal synapse is associated with changes in calcium concentration in photoreceptors and bipolar cells. We investigated how loss of plasma membrane Ca2+ ATPase isoform 2 (PMCA2), the calcium transporter isoform with the highest affinity for Ca2+/calmodulin, affects transmission of rod- and cone-mediated responses. PMCA2 expression in the neuroblast layer was observed soon after birth; in the adult, PMCA2 was expressed in inner segments and synaptic terminals of rod photoreceptors, in rod bipolar cells, and in most inner retinal neurons but was absent from cones. To determine the role of PMCA2 in retinal signaling, we compared morphology and light responses of retinas from control mice and deafwaddler dfw2J mice, which lack functional PMCA2 protein. The cytoarchitecture of retinas from control and dfw2J mice was indistinguishable at the light microscope level. Suction electrode recordings revealed no difference in the sensitivity or amplitude of outer segment light responses of control and dfw2J rods. However, rod-mediated ERG b-wave responses in dfw2J mice were approximately 45% smaller and significantly slower than those of control mice. Furthermore, recordings from individual rod bipolar cells showed that the sensitivity of transmission at the rod output synapse was reduced by approximately 50%. No changes in the amplitude or timing of cone-mediated ERG responses were observed. These results suggest that PMCA2-mediated Ca2+ extrusion modulates the amplitude and timing of the high-sensitivity rod pathway to a much greater extent than that of the cone pathway.


Figures

Figure 1.
Figure 1.
PMCA2 is not expressed in the dfw2J mouse retina. Representative Western blots of PMCA2 from control and dfw2J retinas. Total protein lysates (15–25 μg of protein per lane) were processed for Western blotting by using specific antibodies. Molecular weight standards are indicated in kilodaltons on the side and are marked by arrows. WT, Wild type.
Figure 2.
Figure 2.
PMCA mRNA expression control and dfw2J mouse retina. qPCR analysis of transcript level of PMCA1, PMCA2, PMCA3, and PMCA4 demonstrates that there is no significant compensatory changes in expression of any of the PMCA isoforms in the dfw2J mouse. Data shown are obtained from six retinas that were individually analyzed from three animals of each genotype. Each bar in the figure represents the average across the six samples of three independently run experimental replicates. Error bars denote SEM.
Figure 3.
Figure 3.
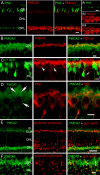
PMCA2 expression and localization in the control and dfw2J mouse retina. A, Control mouse retinal sections labeled with polyclonal antibodies raised against PMCA2. PMCA2 is expressed throughout the postnatal development. At P1, the PMCA2 antibody labels both inner retina and the neuroblast layer. No PMCA2 signal is seen in the absence of the primary antibody. During maturation, the PMCA2 signal gradually retracts from the developing ONL and INL; in the adult, PMCA2 is predominantly expressed in the inner retina, with moderate expression in ganglion cells and photoreceptors. Two brightly stained PMCA2-immunopositive bands are seen in sublaminae a and b, respectively. Scale bar, 20 μm. B, C, Magnified view of the outer retina obtained at higher confocal gain. PMCA2 is expressed in inner segments of rod photoreceptors (arrowheads in B; scale bar, 5 μm) and photoreceptor terminals (arrows in C; scale bar, 10 μm). D, Little PMCA2 immunoreactivity is observed in the dfw2J mouse retina. Scale bar, 20 μm. OLM, Outer limiting membrane; GCL ganglion cell layer.
Figure 4.
Figure 4.
PMCA2 is expressed presynaptically and postsynaptically in the outer plexiform layer. A, PMCA2 does not colocalize with the cone marker PNA. Scale bar, 10 μm. Ai–Aiii, High-resolution detail of the OPL. Scale bar, 5 μm. B, High-resolution image of the OPL double labeled with the photoreceptor terminal marker PSD-95 and PMCA2. Scale bar, 5 μm. C, Retinal section from L7 transgenic mice expressing GFP in rod bipolar cells. Cell bodies of rod bipolar cells express PMCA2 (middle, arrowheads). PMCA2 is also expressed in a subset of GFP-negative cells in the INL (right, arrow). Scale bar, 10 μm. D, High-resolution image of OPL double labeled with PMCA2 and the rod bipolar cell marker protein kinase C (PKC). Colocalization is observed in rod bipolar cell dendrites (arrows) and cell bodies. Scale bar, 5 μm. E, F, Double labeling for PMCA2 and the Müller cell marker glutamine synthetase. E, Partial colocalization is observed in the outer limiting membrane (OLM) and OPL. Scale bar, 5 μm. F, High-resolution image of the OPL labeled with PMCA2 and glutamine synthetase. Scale bar, 5 μm.
Figure 5.
Figure 5.
Retinal structures are normal in dfw2J mice. Light micrographs of retinal sections from a control mouse (A) and a dfw2J littermate (B) at P65. The dfw2J retina has a normal appearance with no evidence of retinal degeneration. Scale bars, 20 μm. A higher-magnification view of slides A and B shows no abnormalities of the photoreceptor ONL, ISs, or OSs in control (C) or dfw2J(D) mice. Scale bars, 10 μm. RPE, Retinal pigment epithelium.
Figure 6.
Figure 6.
Mice homozygous for PMCA2 mutations have abnormal retinal function. Representative scotopic ERG waveforms from control (left) and dfw2J (right) mice in response to a series of white stimuli, beginning below the STR threshold and continuing to a bright (0.4 log cd s m−2) flash. Small arrows indicate stimulus time, and small flash artifacts are present in some tracings. The STR thresholds (arrows) are elevated one-half log unit above control, and a- and b-wave amplitudes are lower in the dfw2J mouse.
Figure 7.
Figure 7.
Scotopic a-wave amplitudes elicited by 2.4 log cd s m−2 flashes are significantly lower (A) and time-to-peak is slower (B) in dfw2J (triangles) than in control (squares) mice. C, Scotopic a- and b-wave amplitudes are significantly reduced at each of a series of intensities increasing in 1 log unit increments among dfw2J compared with control mice (p < 0.02 for scotopic a-waves; p < 0.000001 for scotopic b-waves at all intensities shown). Scotopic b-wave amplitudes are also significantly lower (D) and time-to-peak is slower (E) in dfw2J (triangles) than in control (squares) mice. The ERG data shown in D and E are responses to a +0.4 log cd s m−2 white stimulus, corresponding to 1256 Rh*. Mean values are shown as horizontal lines. F, Scotopic b-wave times-to-peak, but not a-wave times-to-peak, are significantly increased at each of a series of intensities increasing in 1 log unit increments among dfw2J compared with control mice (p < 0.001 for scotopic b-waves at all intensities shown; p = 0.02 for a-waves).
Figure 8.
Figure 8.
Outer segment membrane currents are unaltered by lack of PMCA2. A, Flash family for a single control rod. Each trace is an average of 10 responses. Flashes produced between 2 and 140 Rh*/rod. B, Flash family for a single mutant dfw2J rod. C, Stimulus–response relationship from 22 control and 25 dfw2J rods. Data have been fit with a saturating exponential function. D, Normalized dim flash responses. Responses to flashes producing 0.5–4 Rh* were averaged across control and dfw2J rods. To compare kinetics, the resulting average responses were normalized. All flashes were 10 ms and delivered at t = 0. Bandwidth is 30 Hz.
Figure 9.
Figure 9.
Rod bipolar sensitivity is compromised in the absence of PMCA2. A, Flash family plotted for a single control rod bipolar cell. Each trace is an average of 25 responses. Flashes produced between 0.3 and 40 Rh*/rod. B, Flash family for a single dfw2J rod bipolar cell. C, Stimulus–response relationship from 61 control and 11 dfw2J rod bipolar cells. Data were fit with a Hill curve. D, Normalized dim flash responses. Responses to flashes producing 0.3–0.6 Rh* were averaged across control and dfw2J rod bipolar cells. To compare kinetics, the resulting average responses were normalized. All flashes were 10 ms and delivered at t = 0. Bandwidth is 50 Hz.
Figure 10.
Figure 10.
A, Representative photopic ERG waveforms from control (top trace) and dfw2J (bottom trace) mice in response to a 2 Hz stimulus. The dfw2J recordings (triangles) are similar in amplitude (B) and timing (C) to control responses (squares). Mean values are shown as horizontal lines.

Similar articles

Cited by

References

    1. Armstrong-Gold CE, Rieke F (2003). Bandpass filtering at the rod to second-order cell synapse in salamander (Ambystoma tigrinum) retina. J Neurosci 23:3796–3806. - PMC - PubMed
    1. Barrett EF, Stevens CF (1972). The kinetics of transmitter release at the frog neuromuscular junction. J Physiol (Lond) 227:691–708. - PMC - PubMed
    1. Bayer AU, Mittag T, Cook P, Brodie SE, Podos SM, Maag KP (1999). Comparisons of the amplitude size and the reproducibility of three different electrodes to record the corneal flash electroretinogram in rodents. Doc Ophthalmol 98:233–246. - PubMed
    1. Baylor DA, Lamb TD, Yau KW (1979). The membrane current of single rod outer segments. J Physiol (Lond) 288:589–611. - PMC - PubMed
    1. Berntson A, Smith RG, Taylor WR (2004). Postsynaptic calcium feedback between rods and rod bipolar cells in the mouse retina. Vis Neurosci 21:913–924. - PubMed

Publication types

MeSH terms

Substances

LinkOut - more resources