. 2006 Jul 5;26(27):7281-92.
doi: 10.1523/JNEUROSCI.1072-06.2006.

Intense isolectin-B4 binding in rat dorsal root ganglion neurons distinguishes C-fiber nociceptors with broad action potentials and high Nav1.9 expression

Affiliations

Intense isolectin-B4 binding in rat dorsal root ganglion neurons distinguishes C-fiber nociceptors with broad action potentials and high Nav1.9 expression

Xin Fang et al. J Neurosci. .

Abstract

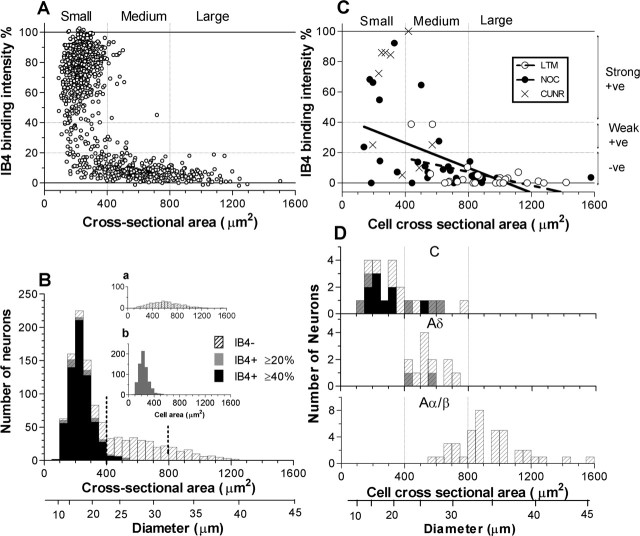
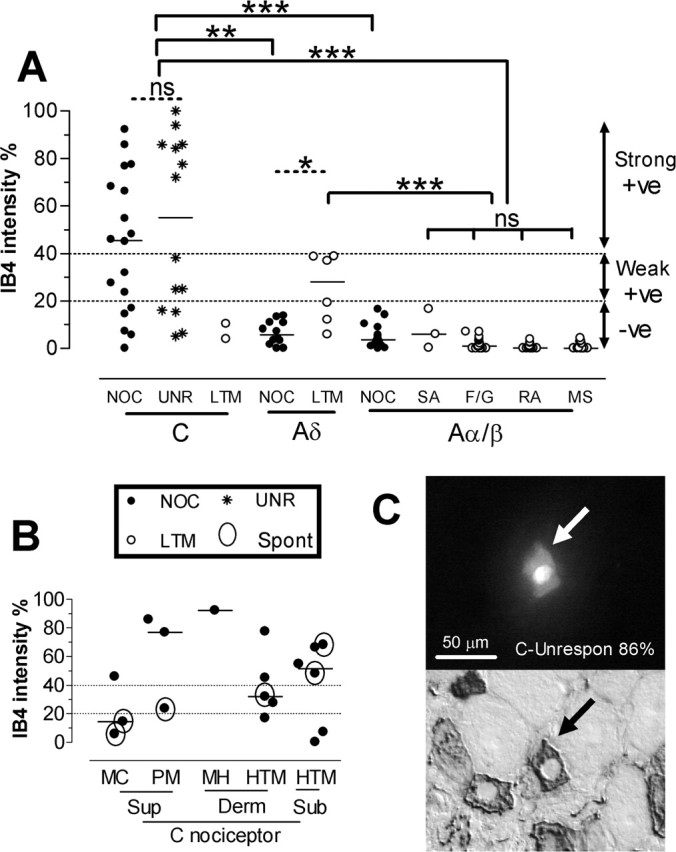
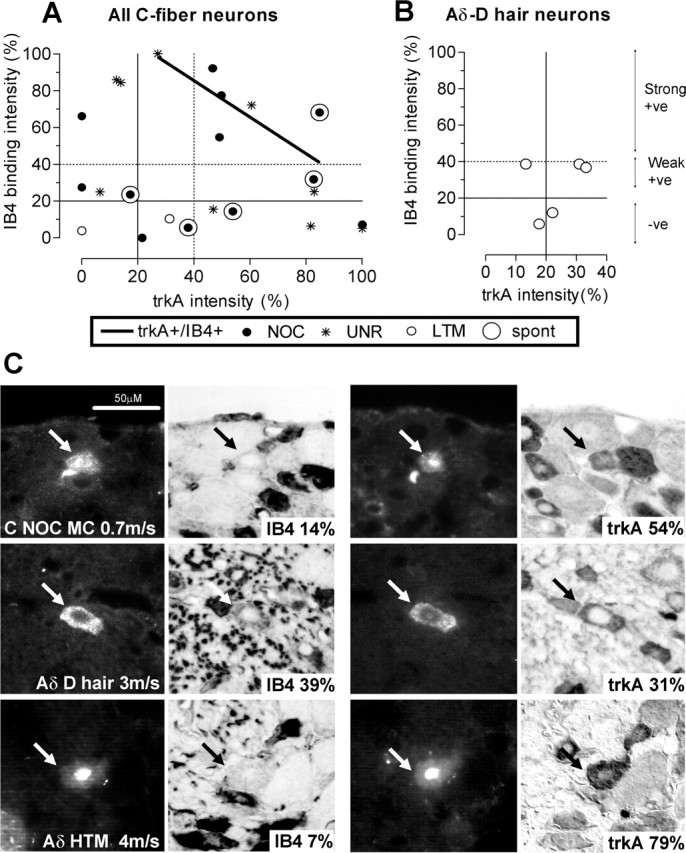
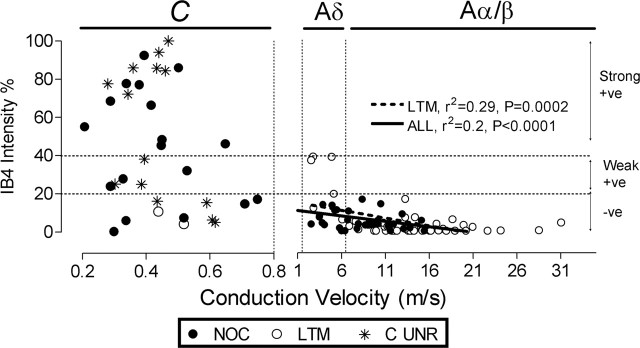
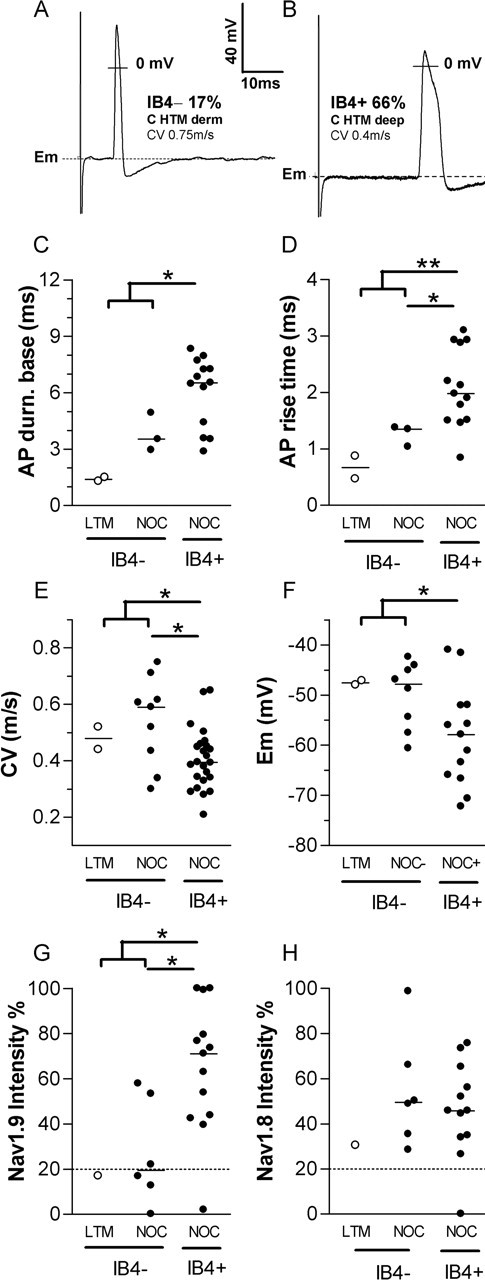
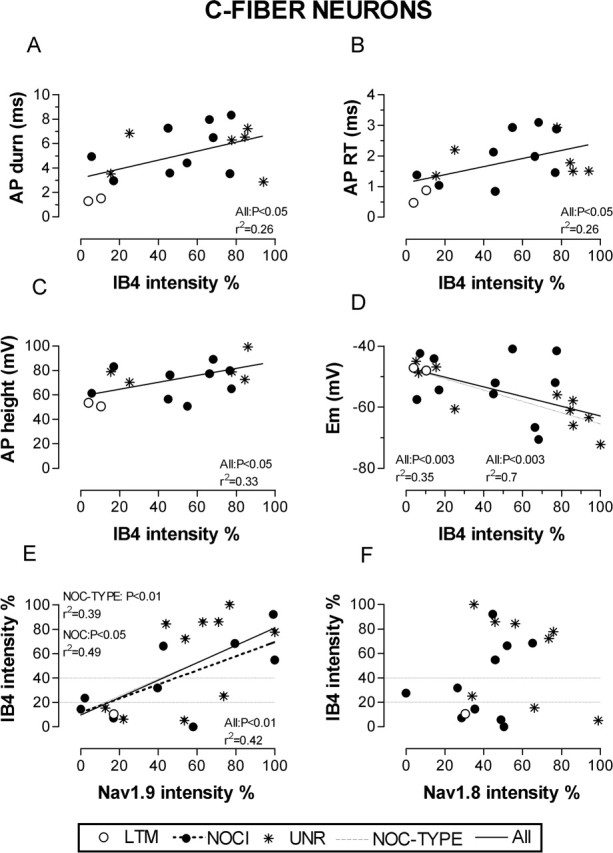
Binding to isolectin-B4 (IB4) and expression of tyrosine kinase A (trkA) (the high-affinity NGF receptor) have been used to define two different subgroups of nociceptive small dorsal root ganglion (DRG) neurons. We previously showed that only nociceptors have high trkA levels. However, information about sensory and electrophysiological properties in vivo of single identified IB4-binding neurons, and about their trkA expression levels, is lacking. IB4-positive (IB4+) and small dark neurons had similar size distributions. We examined IB4-binding levels in >120 dye-injected DRG neurons with sensory and electrophysiological properties recorded in vivo. Relative immunointensities for trkA and two TTX-resistant sodium channels (Nav1.8 and Nav1.9) were also measured in these neurons. IB4+ neurons were classified as strongly or weakly IB4+. All strongly IB4+ neurons were C-nociceptor type (C-fiber nociceptive or unresponsive). Of 32 C-nociceptor-type neurons examined, approximately 50% were strongly IB4+, approximately 20% were weakly IB4+ and approximately 30% were IB4-. Adelta low-threshold mechanoreceptive (LTM) neurons were weakly IB4+ or IB4-. All 33 A-fiber nociceptors and all 44 Aalpha/beta-LTM neurons examined were IB4-. IB4+ compared with IB4- C-nociceptor-type neurons had longer somatic action potential durations and rise times, slower conduction velocities, more negative membrane potentials, and greater immunointensities for Nav1.9 but not Nav1.8. Immunointensities of IB4 binding in C-neurons were positively correlated with those of Nav1.9 but not Nav1.8. Of 23 C-neurons tested for both trkA and IB4, approximately 35% were trkA+/IB4+ but with negatively correlated immunointensities; 26% were IB4+/trkA-, and 35% were IB4-/trkA+. We conclude that strongly IB4+ DRG neurons are exclusively C-nociceptor type and that high Nav1.9 expression may contribute to their distinct membrane properties.


Figures

Figure 1.
Figure 1.
IB4 intensity versus cell size. A–D, Staining intensity of IB4 binding versus cell size in control (non-dye-injected) (A, B) and dye-injected, identified (C, D) DRG neurons. A, B, All neuronal profiles with visible nuclei in sections of three L5 DRGs (one from each of three rats) were measured. Relative intensity of IB4 binding is plotted against soma size (A; cross-sectional area) and as size distribution histograms (B). B, Cross-hatched histograms of all neurons are superimposed by gray histograms of all IB4+ neurons (intensity ≥20%), and superimposed in black are histograms of strongly IB4+ neurons (intensity ≥40%). The inset histogram a shows all IB4− (intensity <20%), and histogram b replicates the gray histogram in B to show all IB4+ (intensity ≥20%) neurons for ease of comparison with a. C, D, Relative intensity of IB4 binding versus cell size in dye-injected, physiologically identified neurons is shown, with overall layout similar to A and B. C, Nociceptors are indicated with filled circles and LTMs with open circles. NOC, Nociceptive neurons; CUNR, C-fiber unresponsive neurons; +ve, positive; -ve, negative. D, Neurons are subdivided according to their dorsal root CVs. Histogram shading in D is as for B. C, There was a significant correlation between the cross-sectional area and IB4-binding intensity in all dye-injected neurons studied (n = 64, Aα/β unresponsive excluded; p < 0.0001; r2 = 0.37) as well as in all nociceptor-type units (n = 38; p = 0.0005; r2 = 0.29) and all LTMs (n = 26, p < 0.01, r2 = 0.27). Vertical dotted lines indicate boundaries between small, medium, and large neurons. Horizontal dotted lines in A and C indicate 20 and 40% borderlines between negative (<20%), weakly positive (20–40%), and strongly positive (>40%) neurons.
Figure 2.
Figure 2.
A, Intensity of IB4 binding in relation to sensory properties and CV. Medians are shown with fine horizontal lines. A-fiber unresponsive units are excluded. NOC, Nociceptive neurons; UNR, C-fiber unresponsive neurons; LTM, low-threshold mechanoreceptive neurons; F/G, field or guard hair neurons; RA, rapidly adapting LTM neurons; SA, slowly adapting LTMs; MS, muscle spindle afferents; +ve, positive; -ve, negative. The dotted lines from the y-axis are as described for Figure 1. Horizontal lines above the columns indicate statistical tests (dotted, Wilcoxon ranking test; solid, Kruskal–Wallis test) between column medians. There was no significant difference between the C-nociceptive and C-unresponsive groups or between the four Aα/β-LTM groups (Kruskal–Wallis test). These were therefore combined to create C-nociceptor-type and Aα/β-LTM groups, respectively. C-nociceptor-type units were compared using a Kruskal–Wallis test with all other groups except C-LTM (too few data). Levels of significance are shown above the lines linking appropriate groups: ns, not significant; *p < 0.05; **p < 0.01; ***p < 0.001. B, The inset shows the data for C-fiber nociceptors divided into subgroups defined by receptive properties and receptive field depth in the tissues. MC, C-mechano-cold; PM, C-polymodal; MH, C-mechano-heat; Sup, superficial; Derm, dermal; Sub, subcutaneous. Open circles around data points indicate which units showed spontaneous (Spont)/ongoing firing. C, An example of a dye-injected C-fiber unresponsive nociceptor-type neuron (top) and the same neuron after immunocytochemistry show strong IB4-binding intensity.
Figure 3.
Figure 3.
TrkA and IB4 colocalization in identified DRG neurons. Immunoreactivity for trkA and IB4 binding measured on different sections through the same dye-injected neurons. A, B, The relationship between relative intensity of IB4-binding (y-axis) and trkA (x-axis) immunoreactivity on different sections of the same C-fiber neurons (A) and Aδ-LTM units (B). From each axis, the solid lines indicate the 20% (positive/negative) borderline and the dotted lines indicate the 40% (weakly positive/strongly positive) borderline. For all C-fiber neurons positive (>20%) for both (5 nociceptive and 3 unresponsive units), there was a significant negative linear correlation between the relative intensity of the two markers (p < 0.05; r2 = 0.62; n = 8). +ve, positive; -ve, negative. C, Photomicrographs of three representative neurons to show IB4 binding and trkA staining on two different sections. Arrows indicate dye-injected profiles before immunocytochemistry (columns 1 and 3) and after immunocytochemistry (columns 2 and 4). Sensory receptive properties and conduction velocity are given on column 1 image; percentage relative staining intensity is also shown (columns 2 and 4). The scale bar (top left image) applies to all photomicrographs. MC, C-mechano-cold; NOC, nociceptive; HTM, high threshold mechanoreceptor.
Figure 4.
Figure 4.
IB4 intensity versus CV. Relationship between IB4-binding immunointensity and CV in identified DRG neurons. IB4 staining for C- (<0.8 m/s) and A- (>1.5 m/s) fiber neurons are shown separately. A-fiber unresponsive units are excluded. The vertical dotted lines from the x-axis indicate the upper border of CV for C-fibers (0.8 ms), C/Aδ- (1.5 m/s), and Aδ-fibers (6.5 m/s). Regression lines, p values, and r2 values are given for significant linear correlations. The dotted lines from the y-axis and symbols are as in Figure 2. NOC, Nociceptive neurons; LTM, low-threshold mechanoreceptive; C UNR, C-fiber unresponsive neurons; +ve, positive; -ve, negative.
Figure 5.
Figure 5.
Electrophysiology and Na+ channel expression in IB4+ and IB4− C-fiber neurons. A, B, Examples of typical somatic APs evoked by dorsal root stimulation in an IB4− C-nociceptor (A), and an IB4+ C-nociceptor (B). derm, Dermal. C–H, Comparison of electrophysiological properties (C–F) and relative intensities of two TTX-resistant Na+ channels (G, H) between IB4− and IB4+ C-fiber neurons (CV, <0.8 m/s). C, AP duration at base; D, AP rise time; E, CV; F, Em; G, Nav1.9 relative intensity; H, Nav1.8 relative intensity. AP duration at base (AP durn. base; C) and AP rise time (D) are plotted only in neurons with overshooting somatic AP and membrane potential more negative than, or equal to, −40 mV. Mann–Whitney U tests were performed to compare the median values of each plotted variable between all of the IB4+ (C-fiber-nociceptor type, nociceptive and unresponsive) units and all of the IB4− units together (nociceptor type plus C-LTM) or all C-fiber IB4− nociceptor-type units. Where a significance was found, asterisks indicate significance levels: *p < 0.05, **p < 0.01. Open symbols indicate C-LTMs; solid symbols indicate C-fiber nociceptor-type units. LTM, Low-threshold mechanoreceptors; NOC, C-nociceptor-type neurons.
Figure 6.
Figure 6.
IB4 intensity versus electrophysiology and Na+ channel expression in C-neurons. A–D, IB4-binding intensity in C-fiber DRG neurons in relation to membrane properties. A, AP duration; B, AP rise time (RT); C, AP height; D, Em. E, F, IB4-binding intensity plotted against Na+ channel expression. E, Nav1.9 intensity; F, Nav1.8 intensity. The criteria for accepting neurons for AP variable analysis are as in Figure 5. NOC/NOCI, nociceptors; UNR, unresponsive; NOC-TYPE, nociceptors and unresponsive units altogether. Where a significant linear correlation exists, regression lines, p values, and r2 values are given for significant linear correlations. The dotted lines from the y-axis and symbols are as in Figure 2.

Similar articles

Cited by

References

    1. Averill S, McMahon SB, Clary DO, Reichardt LF, Priestley JV (1995). Immunocytochemical localization of trkA receptors in chemically identified subgroups of adult rat sensory neurons. Eur J Neurosci 7:1484–1494. - PMC - PubMed
    1. Baker MD, Chandra SY, Ding Y, Waxman SG, Wood JN (2003). GTP-induced tetrodotoxin-resistant Na+ current regulates excitability in mouse and rat small diameter sensory neurones. J Physiol (Lond) 548:373–383. - PMC - PubMed
    1. Bennett DL, Michael GJ, Ramachandran N, Munson JB, Averill S, Yan Q, McMahon SB, Priestley JV (1998). A distinct subgroup of small DRG cells express GDNF receptor components and GDNF is protective for these neurons after nerve injury. J Neurosci 18:3059–3072. - PMC - PubMed
    1. Bogen O, Dreger M, Gillen C, Schroder W, Hucho F (2005). Identification of versican as an isolectin B4-binding glycoprotein from mammalian spinal cord tissue. FEBS J 272:1090–1102. - PubMed
    1. Braz JM, Nassar MA, Wood JN, Basbaum AI (2005). Parallel “pain” pathways arise from subpopulations of primary afferent nociceptor. Neuron 47:787–793. - PubMed

Publication types

MeSH terms