. 2006 Jul 5;26(27):7305-16.
doi: 10.1523/JNEUROSCI.0699-06.2006.

Representation of future and previous spatial goals by separate neural populations in prefrontal cortex

Affiliations

Representation of future and previous spatial goals by separate neural populations in prefrontal cortex

Aldo Genovesio et al. J Neurosci. .

Abstract

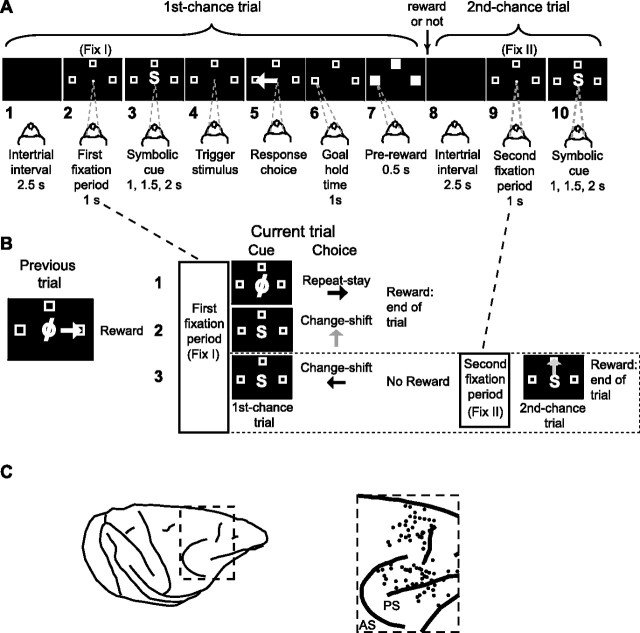
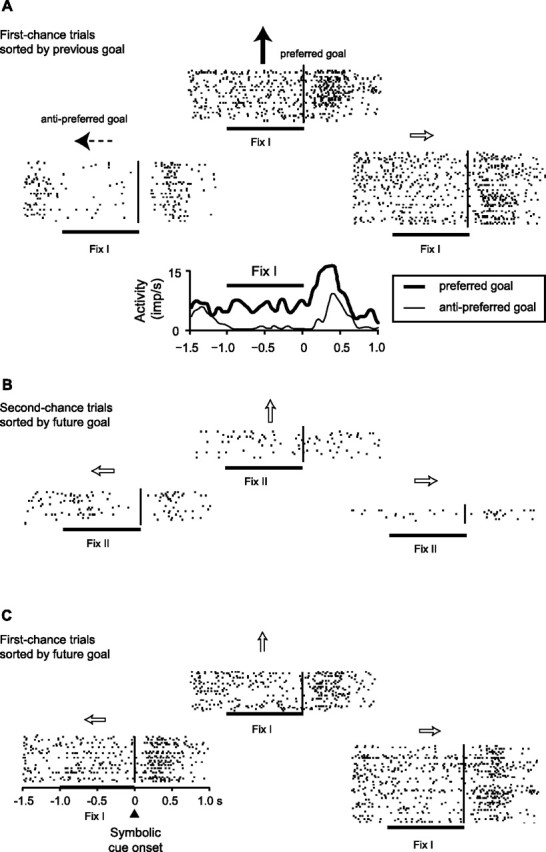
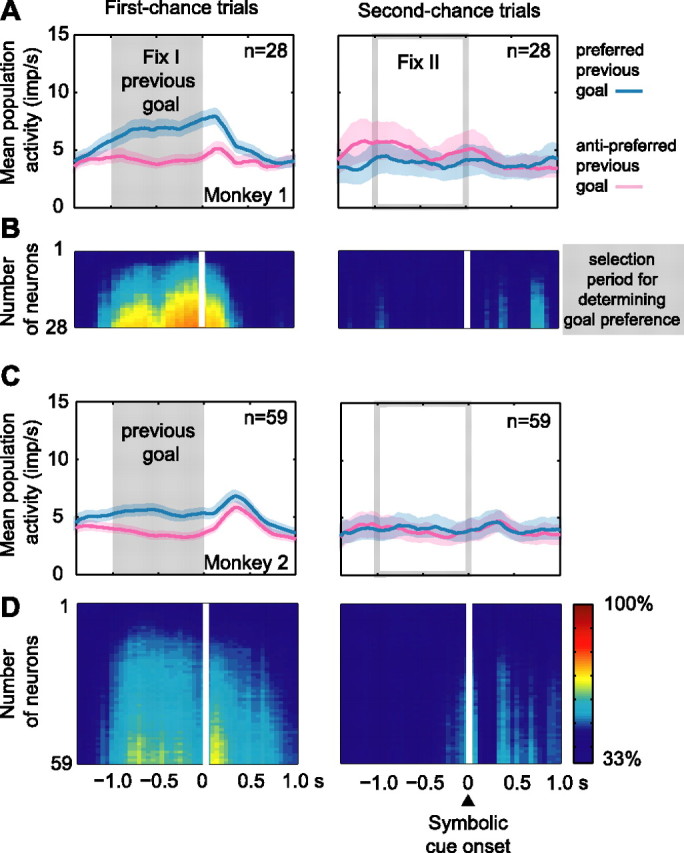
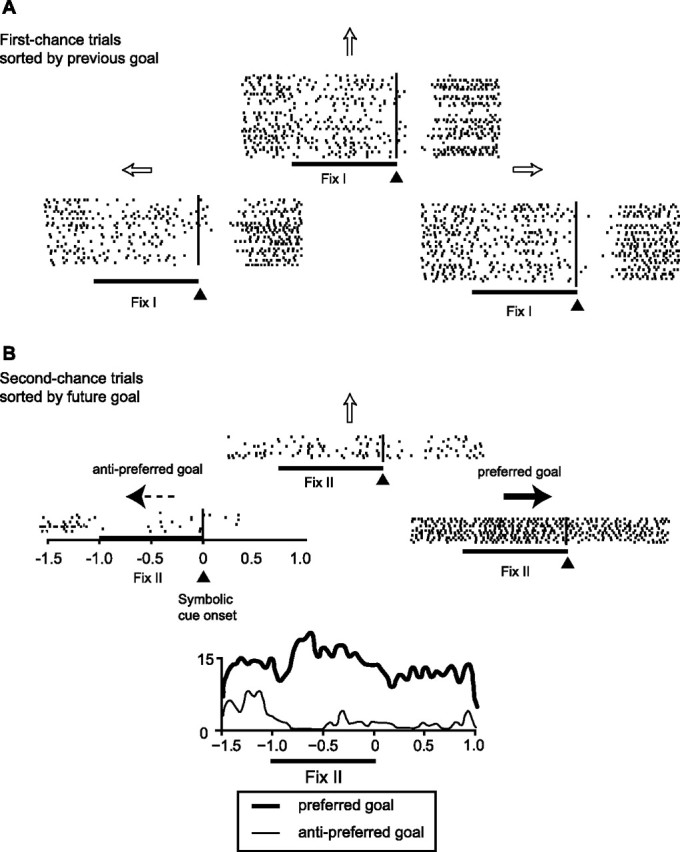
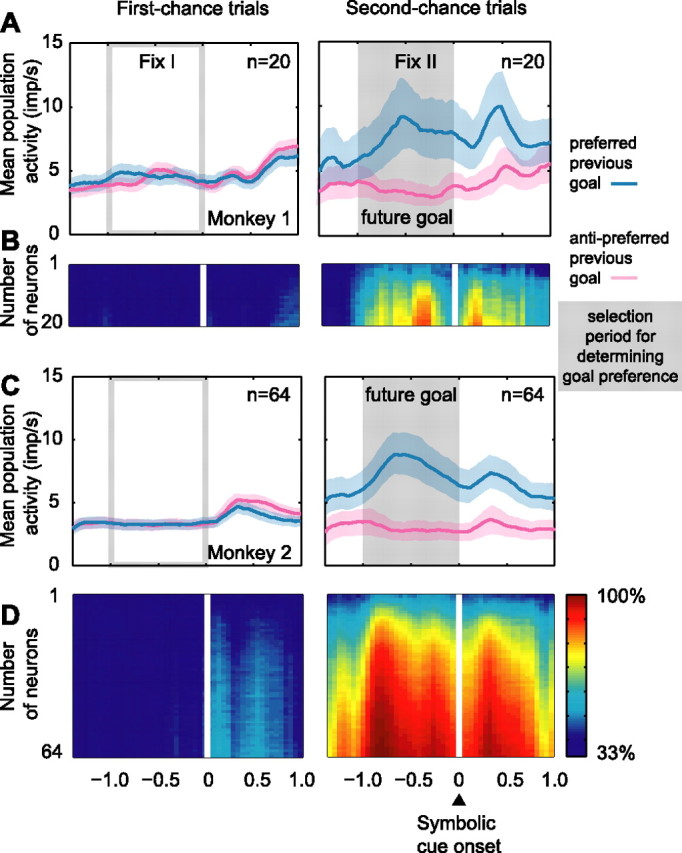
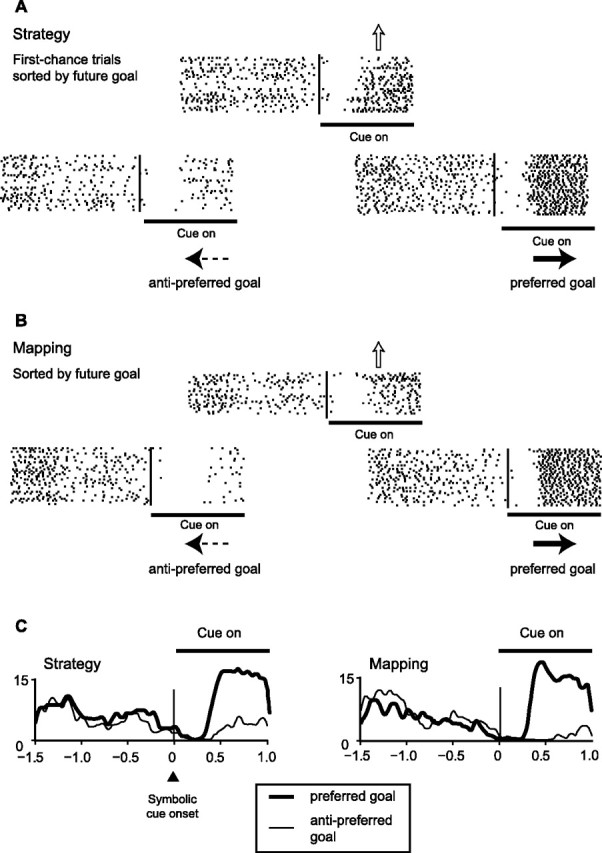
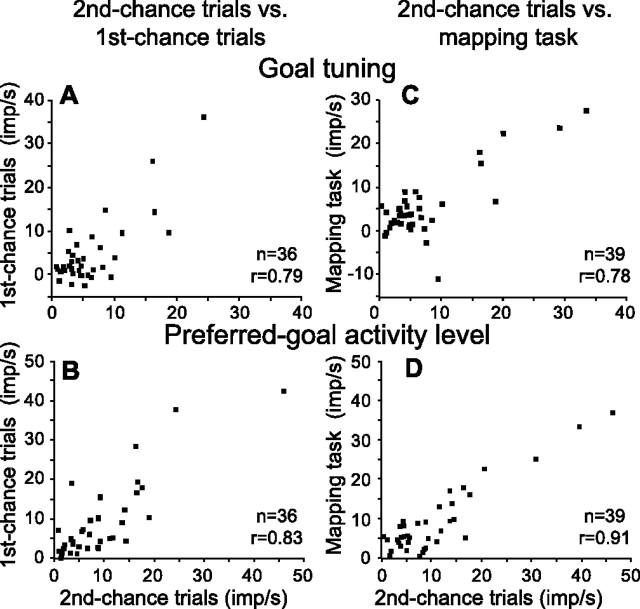
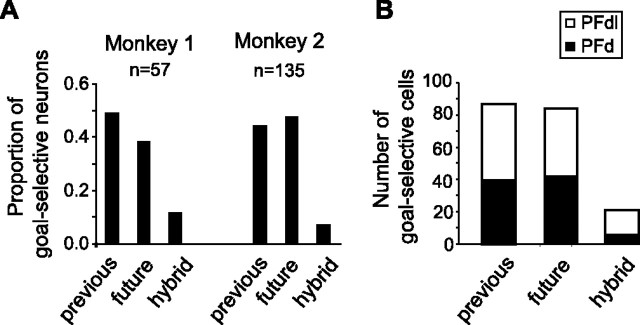
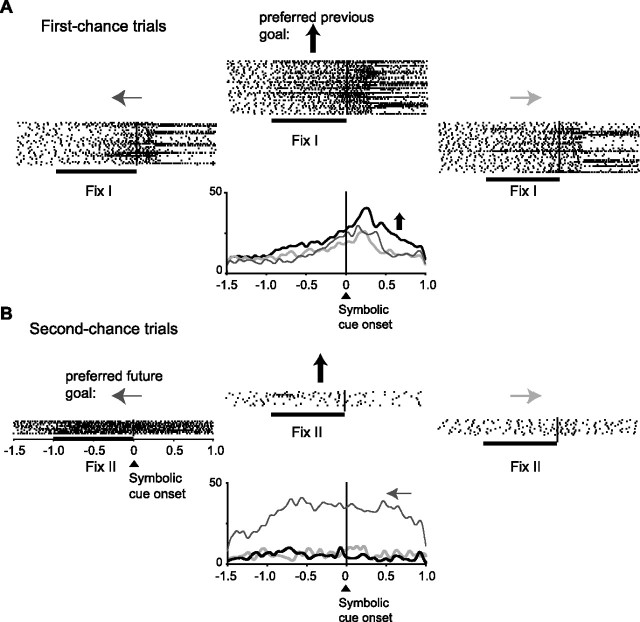
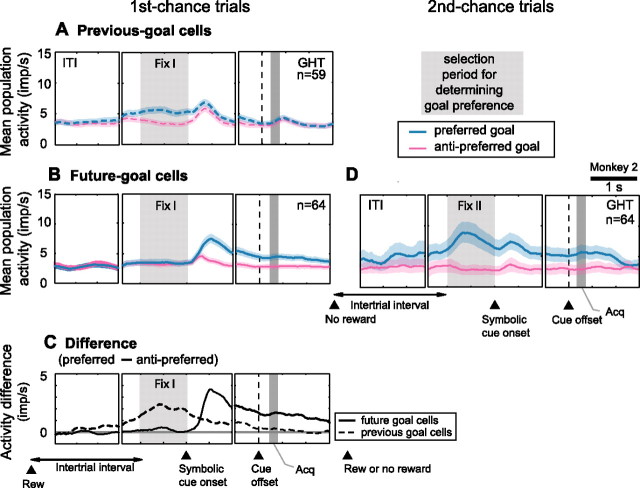
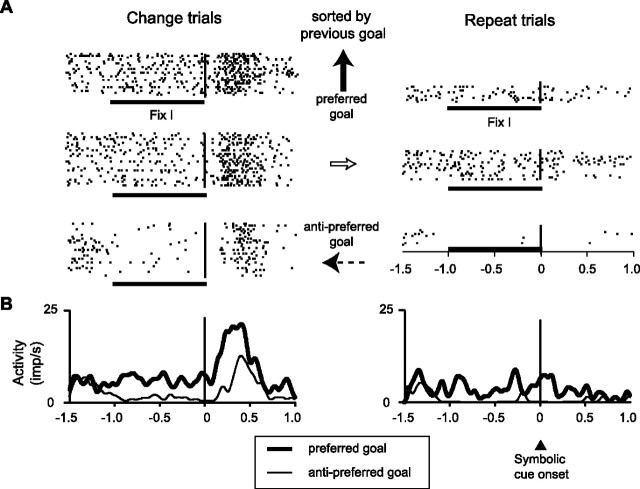
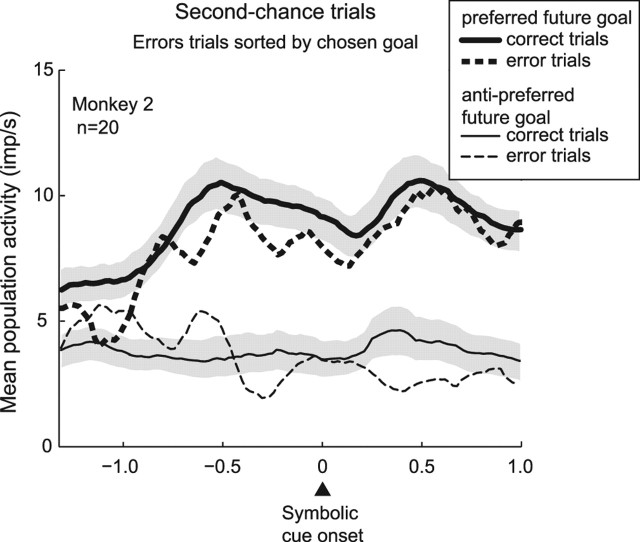
The primate prefrontal cortex plays a central role in choosing goals, along with a wide variety of additional functions, including short-term memory. In the present study, we examined neuronal activity in the prefrontal cortex as monkeys used abstract response strategies to select one of three spatial goals, a selection that depended on their memory of the most recent previous goal. During each trial, the monkeys selected a future goal on the basis of events from the previous trial, including both the symbolic visual cue that had appeared on that trial and the previous goal that the monkeys had selected. When a symbolic visual cue repeated from the previous trial, the monkeys stayed with their previous goal as the next (future) goal; when the cue changed, the monkeys shifted from their previous goal to one of the two remaining locations as their future goal. We found that prefrontal neurons had activity that reflected either previous goals or future goals, but only rarely did individual cells reflect both. This finding suggests that essentially separate neural networks encode these two aspects of spatial information processing. A failure to distinguish previous and future goals could lead to two kinds of maladaptive behavior. First, wrongly representing an accomplished goal as still pending could cause perseveration or compulsive checking, two disorders commonly attributed to dysfunction of the prefrontal cortex. Second, mistaking a pending goal as already accomplished could cause the failures of omission that occur commonly in dementia.


Figures

Figure 1.
Figure 1.
Task sequence and recording locations. A, Sequence of displays and eye positions. Each black rectangle represents a screen at a particular time during the task. The central circle and the three squares indicate the central fixation spot and the three potential response goals, respectively (not to scale). The dashed lines show the monkey's gaze angle, converging on the fixation target. The white arrow shows the saccade. B, By design, the previous trial always ended with a reward. On each current trial, a new symbolic cue was selected pseudorandomly from a set of three. If the cue repeated from the previous trial (1), then the same response that produced reward on the previous trial would also do so on the current trial (right arrow). If the cue changed (2, 3), then the choice of one of the remaining two goals (pseudorandomly selected) did (the top one in this example). Rewarded choices ended the trial, but the unrewarded choice led to second-chance trials (3, dotted box). C, Electrode entry locations (right) and the explored region of the cortex (left). The dashed rectangles match. AS, Arcuate sulcus; PS, principal sulcus. The monkey in A is courtesy of Dr. Michael N. Shadlen (University of Washington School of Medicine, Seattle, WA).
Figure 2.
Figure 2.
PF neuron with activity related to the previous goal. A, First-chance trials sorted into raster displays according to the previous goal. Each raster shows activity on the current, first-chance trial, aligned on the onset of the symbolic cue (black vertical line). The arrows show the previous-goal location relative to the central fixation point. During the Fix I period, the preferred previous-goal location was the top one (solid black arrow), and the anti-preferred goal was the left one (dashed arrow). The plot below the rasters compares average activity for these two previous goals. B, The same cell showed no goal selectivity for future goals during the Fix II period of second-chance trials. C, The same cell also showed no goal selectivity for future goals during the Fix I period of first-chance trials (matching A). imp, Impulses.
Figure 3.
Figure 3.
Previous-goal selectivity at the population level. A, B, Monkey 1. C, D, Monkey 2. A, C, Average population histograms, with 95% confidence limits (shaded area), for the preferred previous goals (blue) and the anti-preferred previous goals (magenta), as determined during the Fix I period of first-chance trials. This subpopulation of PF neurons showed selectivity for previous goal (left) and a lack of selectivity for the same location when it was the future goal (right). B, D, Neuron-dropping analysis for all possible ensemble sizes. The percentage of accurate estimations is indicated by color, with reds and yellows indicating relatively high accuracy and blues indicating lower accuracy, down to chance level (33%). Neuron-dropping curves for activity averaged over the entire fixation period are shown in supplemental Figure 2 (available at www.jneurosci.org as supplemental material). This subpopulation of PF neurons encoded the previous goal (left) but not the future one (right). Note that the accuracy of the previous-goal estimation decreased within 500 ms after the appearance of the symbolic cue, which suggests that information about previous goals was rapidly integrated with other information, such as the previous symbolic cue and the strategy to be used (see also Fig. 9A,C). imp, Impulses.
Figure 4.
Figure 4.
PF neuron with future-goal selectivity. The format is as in Figure 2. Note that this neuron represented the future goal (B) but not the previous goal (A).
Figure 5.
Figure 5.
Future-goal-selective population. The format is as in Figure 3. Note that this subpopulation represented the future goal (right column), but not the previous goal (left column). imp, Impulses.
Figure 6.
Figure 6.
Comparison of future-goal selectivity in the strategy and mapping tasks. The format is as in Figure 2. The same neuron as in Figure 4 is shown. A, Future-goal selectivity during the cue period of first-chance trials matches that seen for this cell in the Fix II period of second-chance trials (see Fig. 4B). B, Future-goal selectivity in the mapping task matched A and Figure 4B, for the first- and second-chance trials of the strategy task, respectively. C, Activity averages for A (left) and B (right).
Figure 7.
Figure 7.
Future-goal selectivity in different tasks and trial types. Comparison of future-goal selectivity in the first-chance versus second-chance trials (A, B) and in the second-chance trials versus the mapping task (C, D). In all plots, the preferred direction was defined during the Fix II period of second-chance trials, and the abscissa shows the goal tuning of the cell during this period, defined as the difference in activity levels between the preferred and anti-preferred future goals. A, C, The ordinate shows goal tuning for first-chance trials (A) and the mapping task (C), with the preferred goal matched to that used for the abscissa. B, D, In the format of A and C, but showing the level of activity for the preferred goal rather than the tuning. imp, Impulses.
Figure 8.
Figure 8.
Population frequencies and counts. A, The proportion of PF neurons, by monkey, selective for previous goal, future goal, or both (hybrids). B, Number of neurons in each class for the dorsal recording sites (PFd) and the dorsolateral ones (PFdl), as illustrated in Figure 1C.
Figure 9.
Figure 9.
A hybrid cell. Raster and histogram displays for a PF neuron with significant selectivity for both the previous and future goals. The format is as in Figure 2.
Figure 10.
Figure 10.
Time course of previous- and future-goal selectivity. A, Average activity of the subpopulation selective for the previous-goal location, in the format of Figure 3A. Note that the previous-goal selectivity decreased during the first part of the symbolic-cue period and was not observable during the preceding intertrial interval or subsequent parts of first-chance trials. B, In the format of A, but for the subpopulation selective for the future-goal location. C, Difference between the preferred and anti-preferred goals, from A (dashed line) and B (solid line). D, In the format of A, but for future-goal cells during second-chance trials. The same subpopulation as in B is shown. Note that selectivity for future goals appeared during the intertrial interval, increased during the Fix II period, increased again after the onset of the symbolic cue, and continued through cue offset, goal acquisition, and the first part of the goal hold time. The shaded gray rectangle labeled Acq corresponds to ±1 SD of the mean. Data are from monkey 2; analogous data for monkey 1 appears in supplemental Figure 4 (available at www.jneurosci.org as supplemental material). imp, Impulses; ITI, intertrial interval; Acq, goal acquisition; GHT, goal hold time; Rew, reward.
Figure 11.
Figure 11.
Previous-goal representation in a strategy-selective cell. The same neuron as in Figure 2 is shown. A, Left column, Raster displays for change trials. Right column, Repeat trials. The cell showed a preference for trials in which the top goal had been selected previously, but only on change trials. B, Activity averages for the preferred (solid arrow) and anti-preferred (dashed arrow) goals from A in each column. The cell is both strategy- and previous-goal selective and has a significant interactive effect between the factors strategy and previous goal during the cue period. imp, Impulses.
Figure 12.
Figure 12.
Error analysis. Average population activity showing that the goal selectivity is for the chosen goal and not for the goal that should have been chosen. Data are from monkey 2. When trials were sorted according to the goal the monkey eventually selected, the goal selectivity on error trials (dashed lines) closely corresponded to that on correct trials (solid lines) for both the preferred (thick lines) and anti-preferred (thin lines) goals. imp, Impulses.

Similar articles

Cited by

References

    1. Asaad WF, Rainer G, Miller EK (1998). Neural activity in the primate prefrontal cortex during associative learning. Neuron 21:1399–1407. - PubMed
    1. Asaad WF, Rainer G, Miller EK (2000). Task-specific neural activity in the primate prefrontal cortex. J Neurophysiol 84:451–459. - PubMed
    1. Averbeck BB, Chafee MV, Crowe DA, Georgopoulos AP (2002). Parallel processing of serial movements in prefrontal cortex. Proc Natl Acad Sci USA 99:13172–13177. - PMC - PubMed
    1. Barraclough DJ, Conroy ML, Lee D (2004). Prefrontal cortex and decision making in a mixed-strategy game. Nat Neurosci 7:404–410. - PubMed
    1. Brass M, Ruge H, Meiran N, Rubin O, Koch I, Zysset S, Prinz W, von Cramon DY (2003). When the same response has different meanings: recoding the response meaning in the lateral prefrontal cortex. NeuroImage 20:1026–1031. - PubMed

Publication types

LinkOut - more resources