. 2006 Aug;15(8):1849-57.
doi: 10.1110/ps.062256606. Epub 2006 Jul 5.

Crystal structures of saposins A and C

Affiliations

Crystal structures of saposins A and C

Victoria E Ahn et al. Protein Sci. 2006 Aug.

Abstract

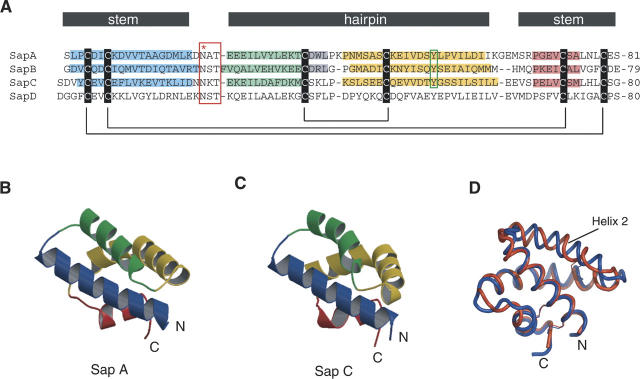
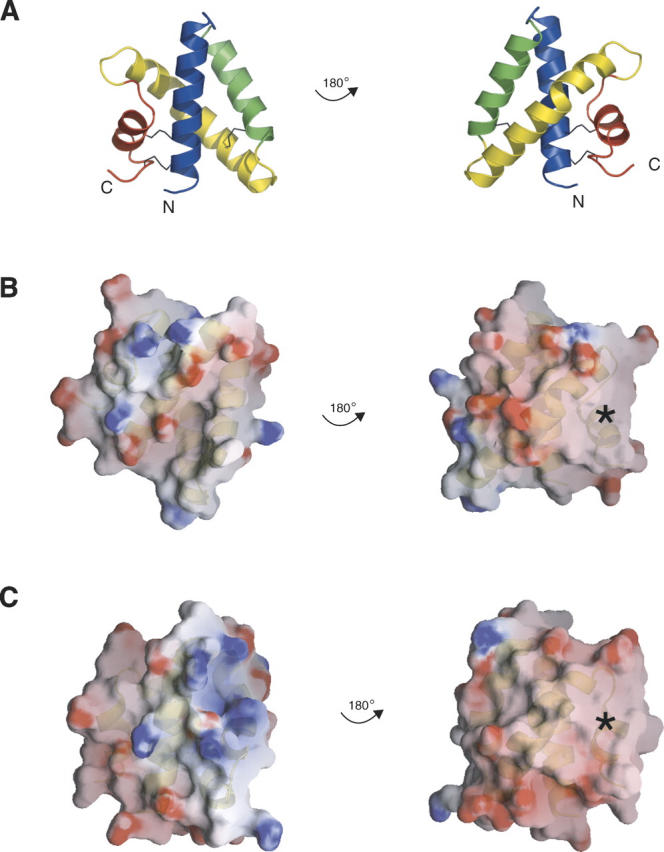
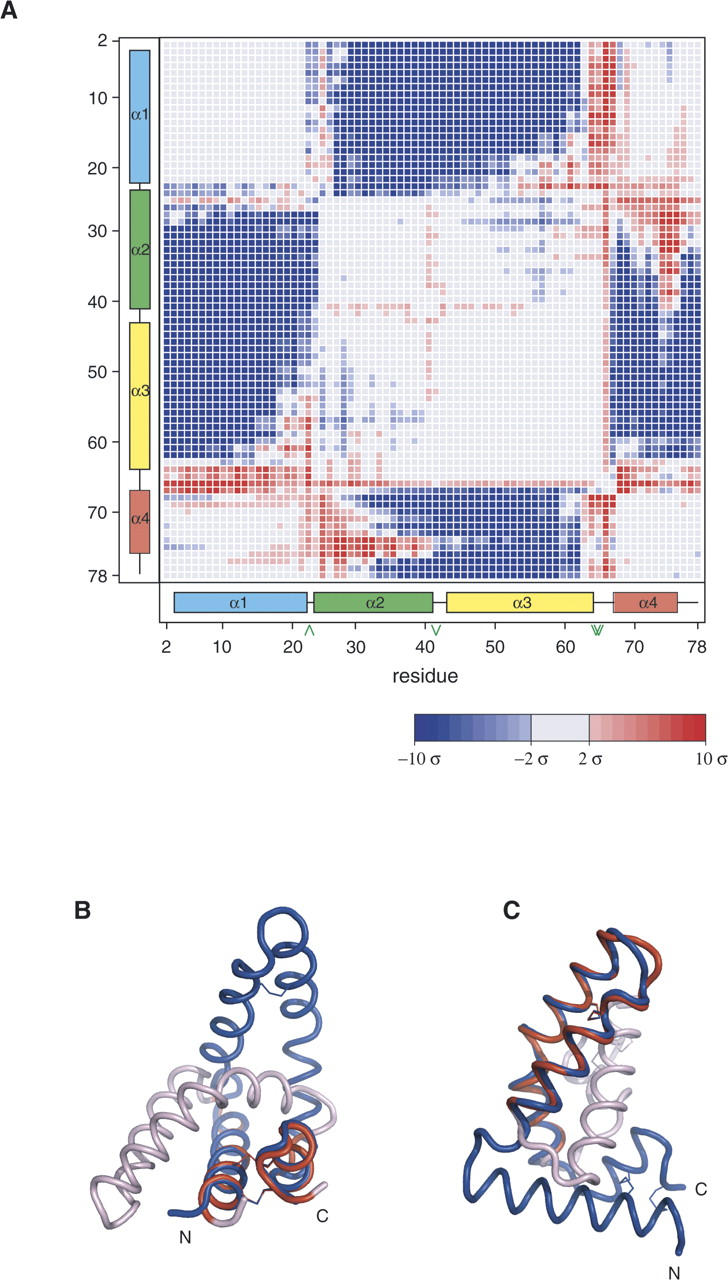
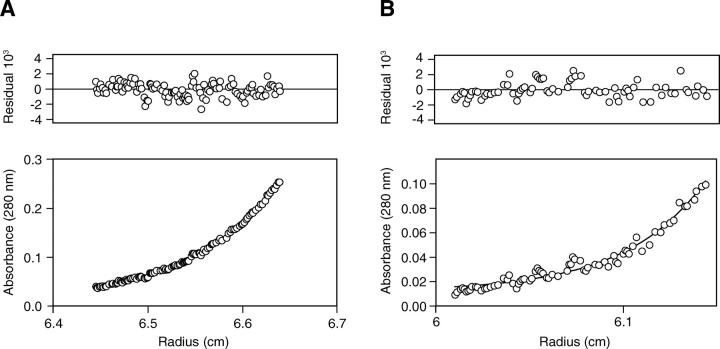
Saposins A and C are sphingolipid activator proteins required for the lysosomal breakdown of galactosylceramide and glucosylceramide, respectively. The saposins interact with lipids, leading to an enhanced accessibility of the lipid headgroups to their cognate hydrolases. We have determined the crystal structures of human saposins A and C to 2.0 Angstroms and 2.4 Angstroms, respectively, and both reveal the compact, monomeric saposin fold. We confirmed that these two proteins were monomeric in solution at pH 7.0 by analytical centrifugation. However, at pH 4.8, in the presence of the detergent C(8)E(5), saposin A assembled into dimers, while saposin C formed trimers. Saposin B was dimeric under all conditions tested. The self-association of the saposins is likely to be relevant to how these small proteins interact with lipids, membranes, and hydrolase enzymes.


Figures

Figure 1.
Figure 1.
Sequence and structures of saposins A and C. (A) Multiple sequence alignment of the four human saposins. The six conserved cysteines are indicated along with their connectivity. Helices 1, 2, 3, and 4 from the known crystal structures are shaded blue, green, yellow, and red, respectively. A turn of 310 helix is present at the end of helix 2 in saposins A and B, and is shaded gray. The red box indicates the conserved N-linked glycosylation site located at the turn between helices 1 and 2. The green box indicates the conserved tyrosine 54 that is found at the position of the kink in helix 3 (see text). The designation of the “stem” and the “hairpin” regions is based on a comparison of related structures (see text). (B,C) Ribbon representation of saposins A and C, with helix coloring according to the scheme in A. (D) A superposition of saposin A (blue) and saposin C (red) shows slight differences in the three loop regions and in α2.
Figure 2.
Figure 2.
Electrostatic surface representations. The left and right columns show the two flat faces of the disc-shaped monomers. Ribbon representations of saposin A are shown in A as a guide to the surfaces shown for saposin A and saposin C in panels B and C. The surfaces are colored by electrostatic potential from –10 kT to 10 kT, where k is the Boltzmann constant and T is temperature in Kelvin (red = negative, blue = positive, white = neutral) as calculated with the program GRASP. The asterisks indicate an uncharged surface patch that is common to saposins A and C.
Figure 3.
Figure 3.
Structural comparison of saposins A and B. (A) Error-scaled difference distance matrix (Schneider 2000) between saposin A (this work) and chain B of saposin B (Ahn et al. 2003a). Blue coloring indicates pairs of Cα atoms that are closer together in the saposin A structure relative to the saposin B structure. Large empty blocks in the matrix indicate regions that are not significantly different between the two structures. (B) Superposition of the stem region of saposin B chain B (blue) and saposin A. Red coloring indicates the saposin A residues 2–21 and 67–80 that were fit to residues 2–21 and 65–78 of saposin B. The remaining residues of saposin A are colored light pink. (C) Saposin A hairpin residues 25–62 were fit to saposin B resides 26–62 and colored red. The remaining saposin A residues that were not used in this superposition are colored light pink. The view of saposin B is rotated 90° about a vertical axis relative to panel B.
Figure 4.
Figure 4.
Sedimentation equilibrium analysis of saposin C. The lower panels represent the protein concentration gradients, and the upper panels represent the residuals of the fit to the sedimentation equilibrium equation. (A) Sedimentation data for 20 μM saposin C in 50 mM Tris (pH 7.0), 150 mM NaCl at 35,000 rpm. The solid line represents the expected curve for a single ideal species of molecular of 10,873 Da resulting from a global analysis from 10 profiles collected at two concentrations and five rotor speeds. (B) Sedimentation data for 20 μM saposin C in 50 mM NaAc (pH 4.8), 150 mM NaCl, 10 mM C8E5 at 35,000 rpm. The solid line represents the expected curve for a single ideal species of molecular weight of 28,078 Da resulting from a global analysis from eight profiles collected at two concentrations and four rotor speeds.

Similar articles

Cited by

References

    1. Abriouel H., Valdivia E., Galvez A., Maqueda M. 2001. Influence of physico-chemical factors on the oligomerization and biological activity of bacteriocin AS-48. Curr. Microbiol. 42: 89–95. - PubMed
    1. Ahn V.E., Faull K.F., Whitelegge J.P., Fluharty A.L., Privé G.G. 2003a. Crystal structure of saposin B reveals a dimeric shell for lipid binding. Proc. Natl. Acad. Sci. 100: 38–43. - PMC - PubMed
    1. Ahn V.E., Faull K.F., Whitelegge J.P., Higginson J., Fluharty A.L., Privé G.G. 2003b. Expression, purification, crystallization, and preliminary X-ray analysis of recombinant human saposin B. Protein Expr. Purif. 27: 186–193. - PubMed
    1. Anderson D.H., Sawaya M.R., Cascio D., Ernst W., Modlin R., Krensky A., Eisenberg D. 2003. Granulysin crystal structure and a structure-derived lytic mechanism. J. Mol. Biol. 325: 355–365. - PubMed
    1. Azuma N., O'Brien J.S., Moser H.W., Kishimoto Y. 1994. Stimulation of acid ceramidase activity by saposin D. Arch. Biochem. Biophys. 311: 354–357. - PubMed

Publication types

LinkOut - more resources