. 2006 Jan;14(1):15-24.
doi: 10.1889/1.2166829.

Post Transmission Digital Video Enhancement for People with Visual Impairments

Post Transmission Digital Video Enhancement for People with Visual Impairments

Matthew Fullerton et al. J Soc Inf Disp. 2006 Jan.

Abstract

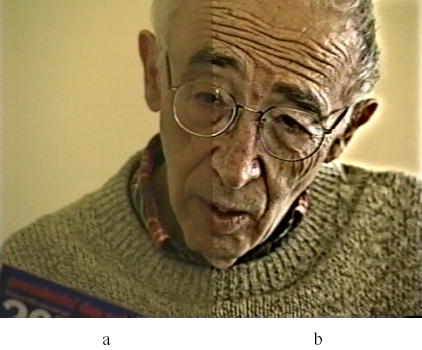
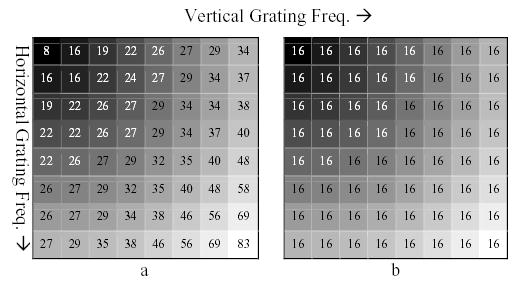
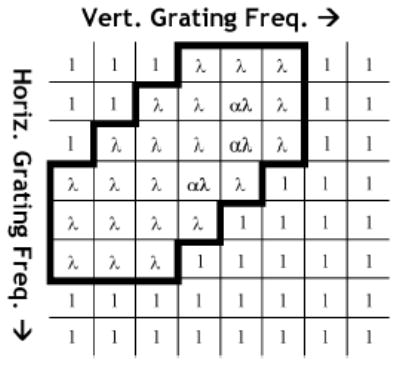
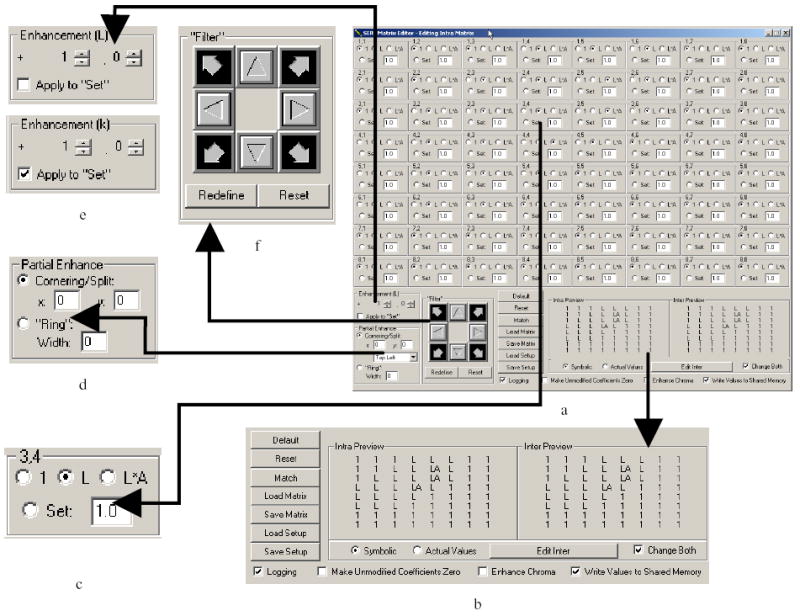
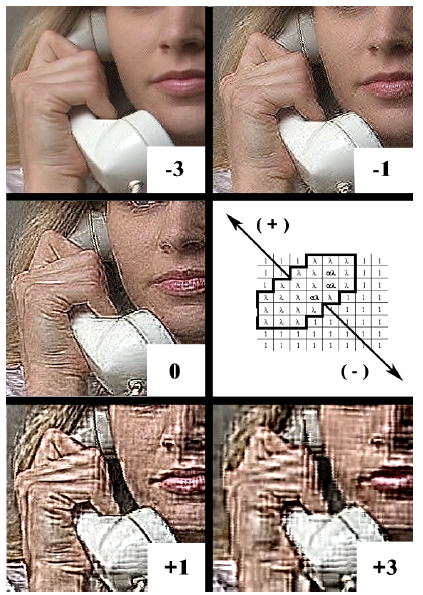
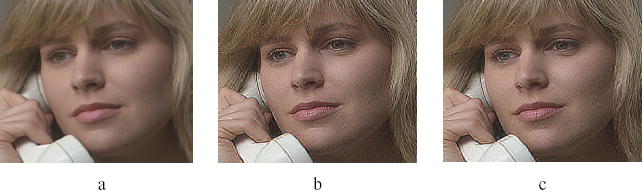
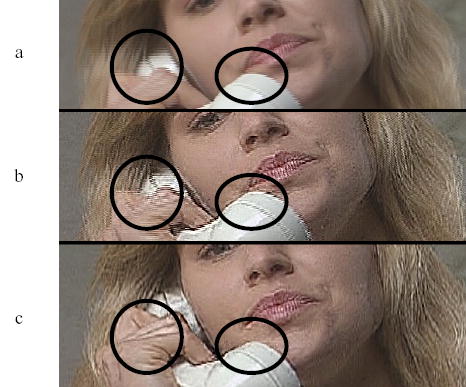
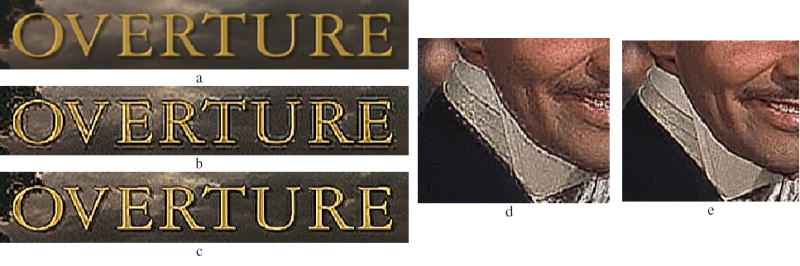
Image enhancement has been shown to improve the perceived quality of images and videos for people with visual impairments. The MPEG coding scheme makes spatial filtering, likely to help those with such impairments, possible at the decoding stage. We implemented a real-time platform for testing and improving contrast enhancement algorithms for MPEG video, with controls appropriate for the target population. The necessary additional processing runs efficiently on a general-purpose PC and can be integrated easily into existing MPEG-2 decoders. The system has enabled us to substantially improve the previous filtering algorithm; reducing artifacts exhibited in the previous implementation and should facilitate individual user-selection of enhancement parameters in evaluation studies.


Figures

Fig. 1
Fig. 1
Digivision® implementation of the adaptive enhancement algorithm, used in a previous study. (a) Section of unenhanced frame. (b) Section of enhanced frame. Image taken from “Hope in Sight”, an educational and motivational video for patients with age-related macular degeneration (AMD) and their caretakers, developed by the New England Research Institute. The video was produced with the enhancement shown at b.
Fig. 2
Fig. 2
(a) Default Quantization matrix for intra-blocks. Values closest to the upper-left corner are quantized the least as most of the significant information in the DCT transformed block is located here. Values closest to the lower-right corner are quantized more harshly. Bands of increasing spatial frequency from upper-left to lower-right are illustrated as a black to white gradient. (b) The MPEG standard defines a default 8×8 matrix for inter-blocks whose values have a uniform value (16). The difference or error coded by these inter blocks does not have the same spatial frequency spectrum commonly found in natural images.
Fig. 3
Fig. 3
The band enhancing filter matrix applied in the previous study. Values within the lined area correspond to the locations of frequencies to be enhanced using a variable λ and approximate four curved bands of spatial frequency (ranging from 2.8 to 6.8 cycles/degree within the constraints given in Section 1.3). These frequencies were chosen to match the range of frequencies that require higher contrasts to be seen by those with visual impairments due to disease of the central retina. Three of the coefficients are multiplied by an additional value, α. This introduced an asymmetry to the enhancement. This was done to emphasize vertical edge enhancement relative to horizontal edges in an effort to reduce interlacing artifacts. Values of α=1.5 and 1 ≤ λ ≤ 5 were used in the previous study.
Fig. 4
Fig. 4
Interface developed for control of MPEG enhancement parameters and matrix coefficients with key sections enlarged to show details. Default settings are shown. (a) Full interface – inter and intra filter matrices (lower right corner) are selectable and editable. (b) Global controls and a preview of the filter matrices (shown in symbolic format, but actual values can also be shown if required). (c) Enlargement of one of 64 matrix element controls, where L represents the parameter λ and A the parameter α. (d) Controls to leave a portion of output unenhanced. (e) Setting of λ (original filter, Fig. 3) or k (scalar on manually set values, Section 2.2.4). (f) Shifting controls for moving a defined set of coefficients (‘filter’) around the 8×8 matrix.
Fig. 5
Fig. 5
Small section of video output shown for clear visibility of details of changes whilst moving the set of coefficients (λ=10.0, α=1.5) along the block diagonal axis as shown. Positive values indicate shifting the matrix into areas of lower spatial frequency. Negative values indicate shifting the matrix into areas of higher spatial frequency. Note the very small visible effect once the filter is not modifying any information within the area of the top six diagonal lines (−3).
Fig. 6
Fig. 6
This frame illustrates partial screen enhancement (to the right of the dashed line) and a situation (letters moving leftward) where partially enhanced macroblocks appear on the unenhanced section of the frame. Predicted blocks based on an enhanced reference from the right side of the line appear moderately enhanced on the left side of the line. The area where the effect is most obvious has been indicated with arrowheads. The dividing line has been added for clarity of the illustration; it does not appear on the screen.
Fig. 7
Fig. 7
Illustration of MPEG based enhancement using the new method (libmpeg2) demonstrating replication of the previous (Restream™) method. (a) New method with λ=1.0, α=1.0. (Unenhanced image) (b) Previous method with λ=4.0, α=1.5. (c) New method with λ=4.0, α=1.5.
Fig. 8
Fig. 8
Enhancement and reduction of interlacing (“motion”) artifacts. Shown are three segments of frames from a motion event. Areas where the effect is particularly prominent have been encircled for emphasis and comparison. (a) Interlacing artifacts caused by the combination of two fields from two different instants in time. (b) Enhancement (λ=4.0, α=1.5) without deinterlacing accentuates these artifacts. (c) Using VLC ‘linear’ deinterlacing filter reduces these interlacing or “motion” artifacts.
Fig. 9
Fig. 9
Illustration of ringing artifacts and their reduction. (a) Unenhanced section of frame with text. (b) Text is particularly prone to ringing artifacts caused by enhancing too limited a band of frequencies in the DCT block. (c) Our more recent filtering techniques (example Fig. 10) have substantially reduced these ringing artifacts, without reducing the contrast enhancement effect. (d) Curved edges appear ‘jagged’ when ringing artifacts are caused by the DCT filtering. (e) The more recent filtering applied has reduced these artifacts.
Fig. 10
Fig. 10
Example of new filter developed using our implementation. This provides smoother, high pass filtering of the DCT transformed blocks than that of Fig. 3. Using the scheme set out in Section 2.2.4, each coefficient in the table is multiplied by the scalar k (set by the user interface, Fig. 4e), and the result increased by one. Values of 10 ≤ k ≤ 40 have been found to provide a useful enhancement in lab pilot tests.

References

    1. American Foundation for the Blind, “Who’s Watching? A Profile of the Blind and Visually Impaired Audience for Television and Video,” See http://www.afb.org/section.asp?SectionID=3&TopicID=140&DocumentID=1232
    1. Peli E, Peli T. “Image enhancement for the visually impaired,”. Optical Engineering. 1984;23(1):47–51.
    1. E Peli, “Recognition performance and perceived quality of video enhanced for the visually impaired.,” Ophthalmic and Physiological Optics (in press), (2005). - PMC - PubMed
    1. Peli E, Goldstein RB, Young GM, Trempe CL, Buzney SM. “Image enhancement for the visually impaired - simulations and experimental results,”. Investigative Ophthalmology & Visual Science. 1991;32(8):2337–2350. - PubMed
    1. Peli E, Lee E, Trempe CL, Buzney SM. “Image enhancement for the visually impaired: the effects of enhancement on face recognition,”. Journal of the Optical Society of America. 1994;11(7):1929–1939. - PubMed

LinkOut - more resources