. 2006 Jul;116(7):2005-11.
doi: 10.1172/JCI27021.

Possible axonal regrowth in late recovery from the minimally conscious state

Affiliations

Possible axonal regrowth in late recovery from the minimally conscious state

Henning U Voss et al. J Clin Invest. 2006 Jul.

Abstract

We used diffusion tensor imaging (DTI) to study 2 patients with traumatic brain injury. The first patient recovered reliable expressive language after 19 years in a minimally conscious state (MCS); the second had remained in MCS for 6 years. Comparison of white matter integrity in the patients and 20 normal subjects using histograms of apparent diffusion constants and diffusion anisotropy identified widespread altered diffusivity and decreased anisotropy in the damaged white matter. These findings remained unchanged over an 18-month interval between 2 studies in the first patient. In addition, in this patient, we identified large, bilateral regions of posterior white matter with significantly increased anisotropy that reduced over 18 months. In contrast, notable increases in anisotropy within the midline cerebellar white matter in the second study correlated with marked clinical improvements in motor functions. This finding was further correlated with an increase in resting metabolism measured by PET in this subregion. Aberrant white matter structures were evident in the second patient's DTI images but were not clinically correlated. We propose that axonal regrowth may underlie these findings and provide a biological mechanism for late recovery. Our results are discussed in the context of recent experimental studies that support this inference.


Figures
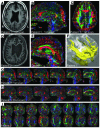
Figure 1
Figure 1. MRI data: structural images, FA maps, and fiber reconstruction.
(AE) Axial T1-weighted anatomical images (A, patient 1; D, patient 2), sagittal FA color maps (B, patient 1; E, normal control), and axial FA color map of patient 1 (C) corresponding to slice in A. Color is composed of red, blue, and green, indexing whether anisotropy is most pronounced from left to right, superior to inferior, or anterior to posterior, respectively. The patient’s MPO ROI is marked by a dashed line in B, and the slice position of B corresponds to the dashed line in C. The normal control subject with the most pronounced anisotropy in the MPO region is identified as a square mark in Figure 2J. (F) White matter fiber tracts of the patient in the MPO region of the brain, overlaid onto an axial T2-weighted image. (G) Sequence of parasagittal FA maps of patient 1, first scan. The images are ordered from left to right and the space between them is 1.7 mm. (H) Sequence of parasagittal FA maps for patient 1 obtained from the second scan, with the same spacing as before. In the second scan, the vermis appears more and the MPO region less pronounced. (I) Axial FA maps of patient 2. The images are ordered from inferior to superior and have a spacing of 2.5 mm.
Figure 2
Figure 2. Quantification of white matter reorganization.
(A) Histogram of average apparent diffusion constant (Dav) of patient 1 (bold line) and the 20 normal control subjects over all voxels in the brain. The histogram of the patient shows an enlarged compartment of CSF as compared with normal subjects. (B) Same as A for the FA. The patient’s histogram lacks large FA values, characteristic for overall white matter degeneration. (C and D) Comparison of histograms of patient 1 for the first (solid lines) and second scan 18 months later (dotted lines). (E and F) Same as A and B for the second patient. (G and H) Histograms of Dav and FA of a normal control subject who was scanned 3 times within a week (solid lines) and then once 17 months later (dashed lines). (I) FA versus Dav for patient 1 (open circle, first scan; open square, second scan) and the 20 normal control subjects (closed circles) for an ROI in the medial corpus callosum, showing pronounced white matter atrophy in the patient’s brain. Bars indicate standard deviations over the ROI. (J) FA-c diagram of the MPO region of patient 1 (open circle, first scan; open square, second scan) and 20 normal control subjects (closed circles). c quantifies the right-left component of the main diffusion direction whereas FA quantifies the overall anisotropy. The closed square marks the control subject referred to in Figure 1E. Bars indicate mean standard deviations over ROI as measured by 3 of the authors. (K) Same as J but for the inferior part of the vermis. Bars indicate standard deviations over the ROI.
Figure 3
Figure 3. Sagittal PET-CT images of patient 1’s brain.
The FDG uptake is displayed as brown (smaller uptake value) to white (larger uptake values). The CT image is displayed in bluish tones. The area marked by an arrow corresponds to the area marked in Figure 1B.

Comment in

Similar articles

Cited by

References

    1. Giacino J.T., et al. The minimally conscious state – definition and diagnostic criteria. Neurology. 2002;58:349–353. - PubMed
    1. Fins J.J. Constructing an ethical stereotaxy for severe brain injury: balancing risks, benefits and access. Nat. Rev. Neurosci. 2003;4:323–327. - PubMed
    1. Basser P.J., Mattiello J., Le Bihan D.1994Estimation of the effective self–diffusion tensor from the NMR spin echo . J. Magn. Res. B. 103247–254. - PubMed
    1. Wakana S., Jiang H., Nagae-Poetscher L.M., van Zijl P.C., Mori S.2004Fiber tract–based atlas of human white matter anatomy . Radiology. 23077–87. - PubMed
    1. Liu A.Y., Maldjian J.A., Bagley L.J., Sinson G.P., Grossman R.I.1999Traumatic brain injury: diffusion-weighted MR imaging findings . AJNR Am. J. Neuroradiol. 201636–1641. - PMC - PubMed

Publication types