Comparative Study
. 2006 Jul;5(7):1688-700.
doi: 10.1021/pr060108z.

Protein separation and characterization by np-RP-HPLC followed by intact MALDI-TOF mass spectrometry and peptide mass mapping analyses

Affiliations
Comparative Study

Protein separation and characterization by np-RP-HPLC followed by intact MALDI-TOF mass spectrometry and peptide mass mapping analyses

Claire Dauly et al. J Proteome Res. 2006 Jul.

Abstract

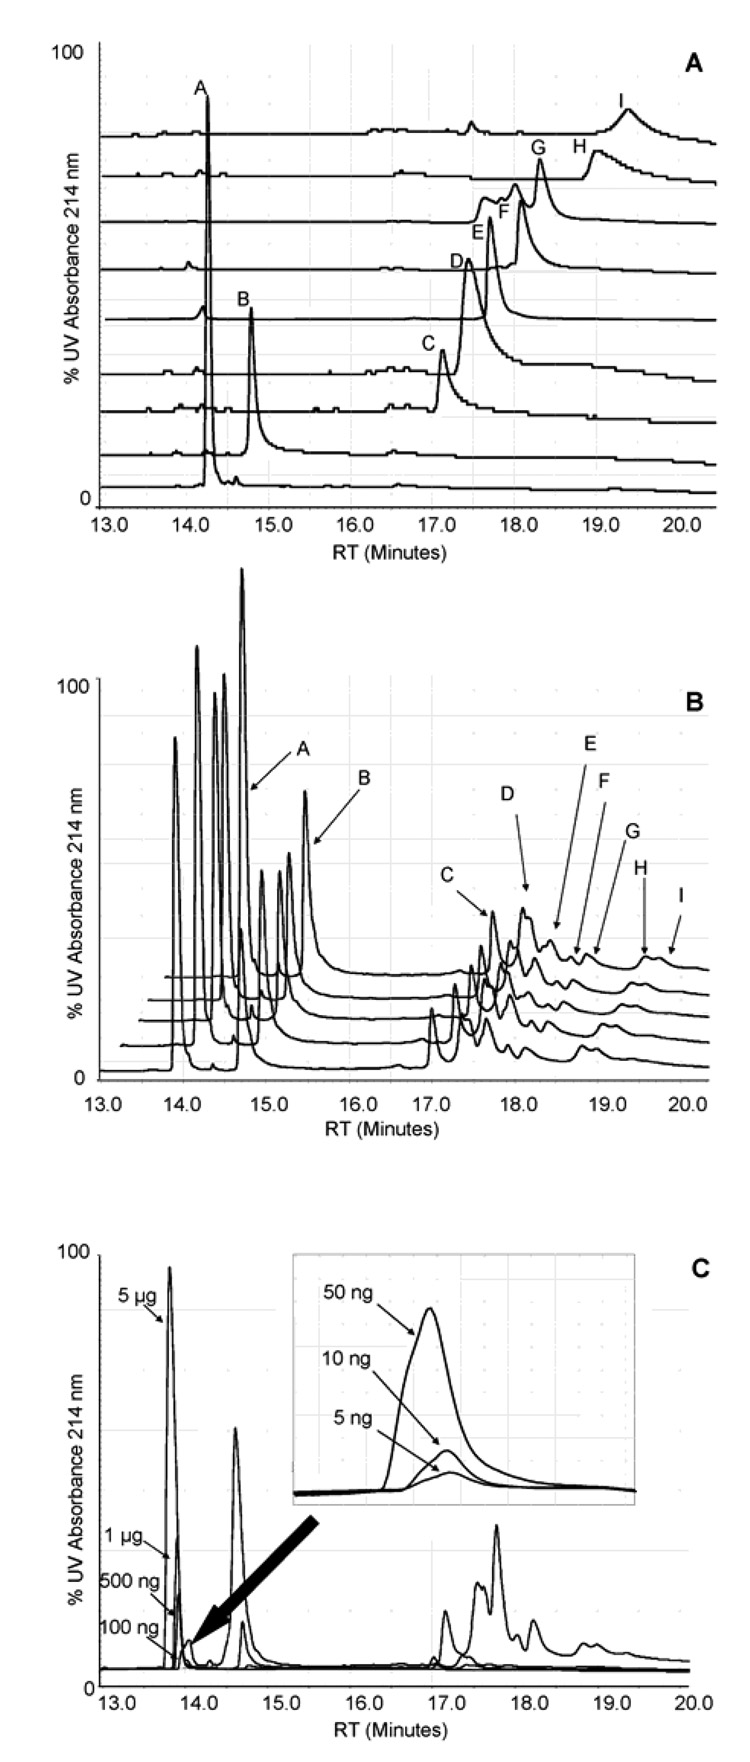
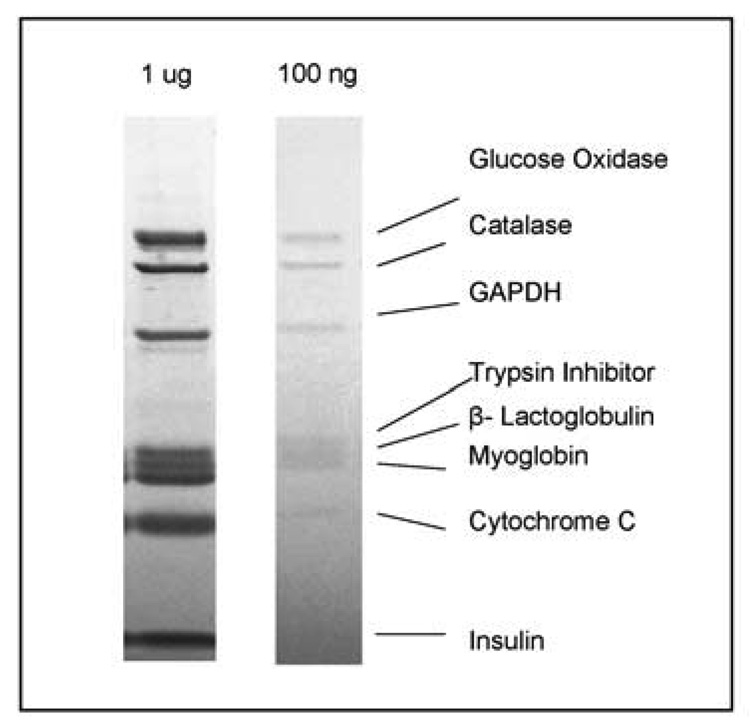
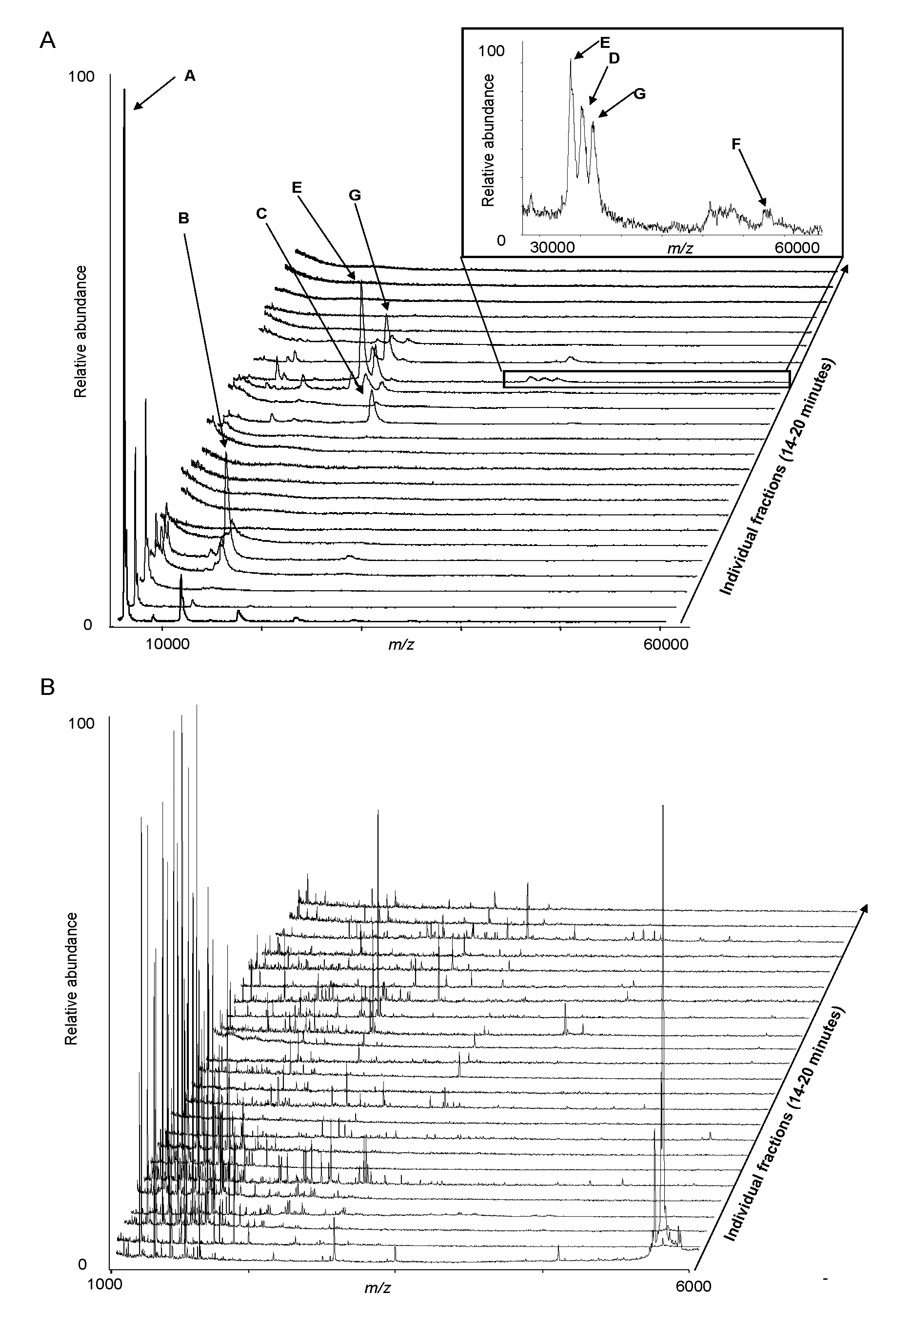
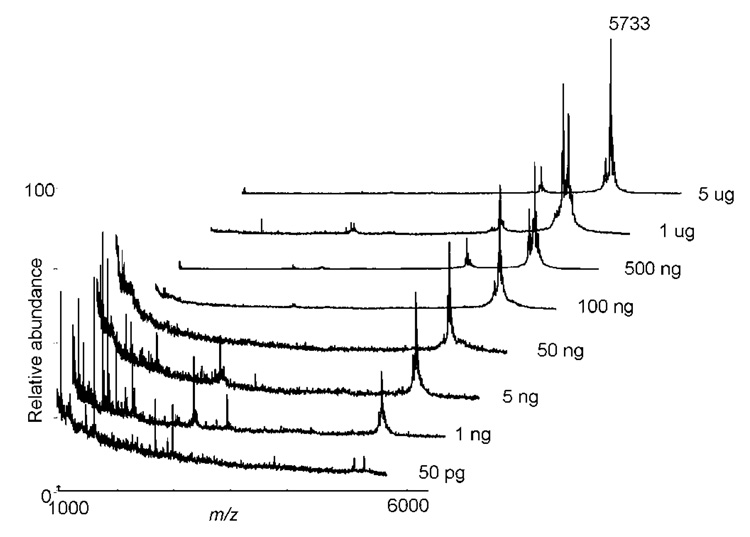
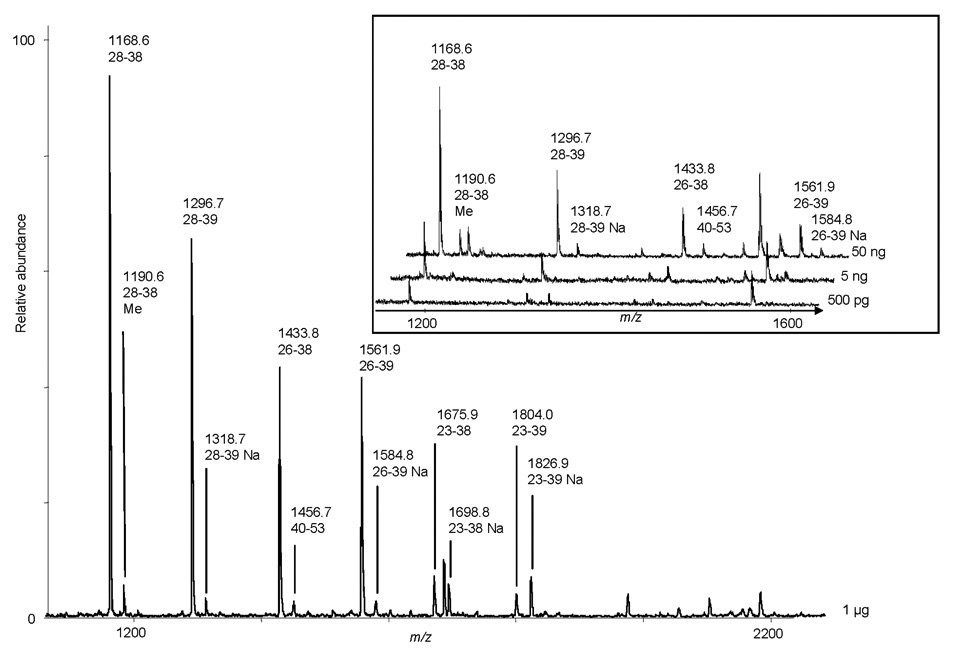
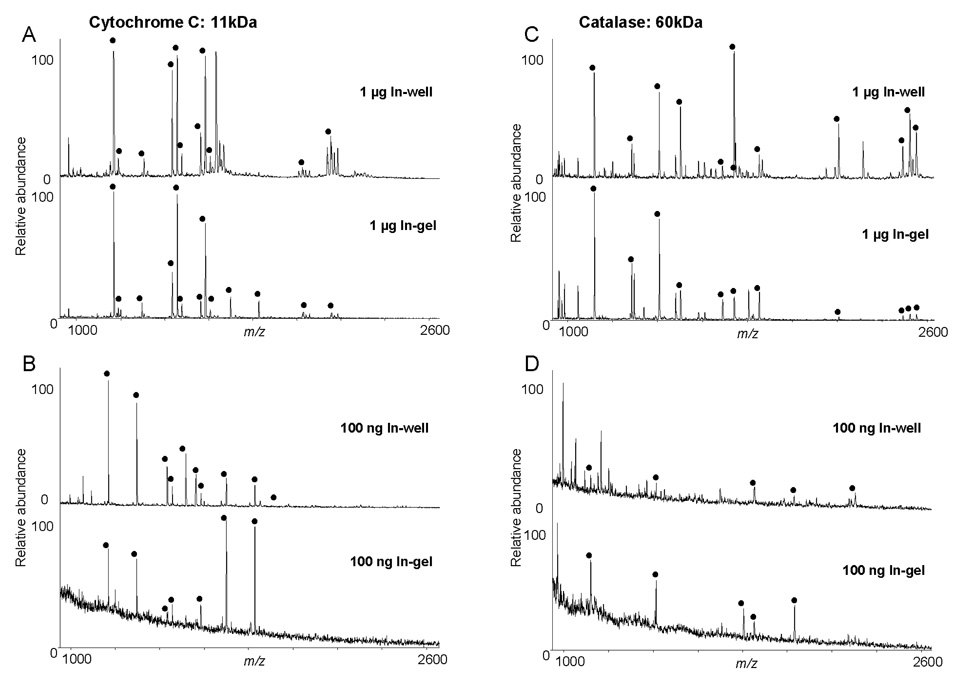
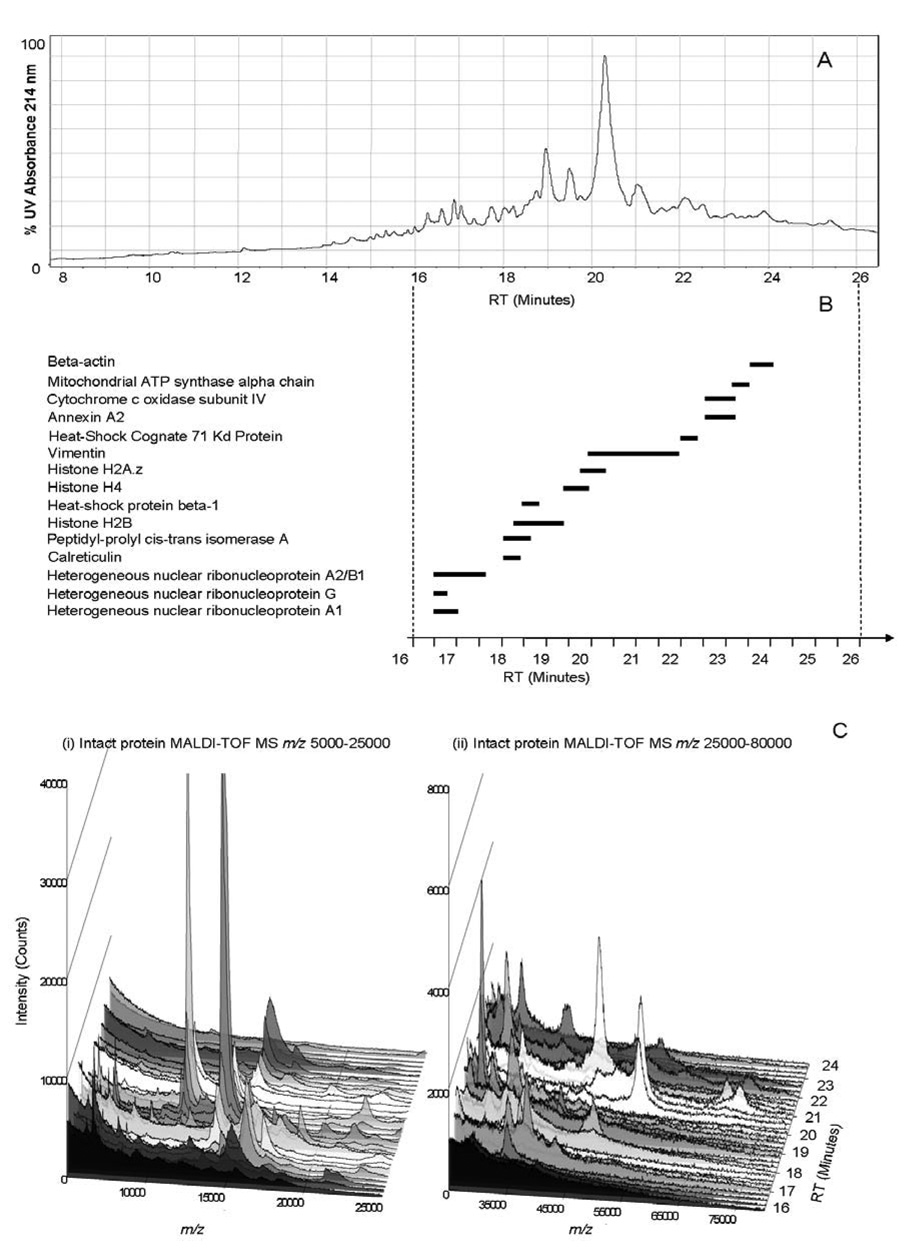
Because of their complexity, the separation of intact proteins from complex mixtures is an important step to comparative proteomics and the identification and characterization of the proteins by mass spectrometry (MS). In the study reported, we evaluated the use of nonporous-reversed-phase (np-RP)-HPLC for intact protein separation prior to MS analyses. The separation system was characterized and compared to 1D-SDS-PAGE electrophoresis in terms of resolution and sensitivity. We demonstrate that np-RP-HPLC protein separation is highly reproducible and provides intact protein fractions which can be directly analyzed by MALDI-TOF-MS for intact molecular weight determination. An in-well digestion protocol was developed, allowing for rapid protein identification by peptide mass fingerprinting (PMF) and resulted in comparable or improved peptide recovery compared with in-gel digestion. The np-RP sensitivity of detection by UV absorbance at 214 nm for intact proteins was at the low ng level and the sensitivity of peptide analysis by MALDI-TOF-MS was in the 10-50 fmol level. A membrane protein fraction was characterized to demonstrate application of this methodology. Among the identified proteins, multiple forms of vimentin were observed. Overall, we demonstrate that np-RP-HPLC followed by MALDI-TOF-MS allows for rapid, sensitive, and reproducible protein fractionation and very specific protein characterization by integration of PMF analysis with MS intact molecular weight information.


Figures

Figure 1
Figure 1. Separation of a protein standard mixture by np-RP HPLC
Individual protein chromatograms, 1 ug each, (A) from a protein standard were analyzed by a high pressure liquid chromatography System Gold, controlled by 32 Karat software and equipped with UV detection at 214 nm (Beckman Coulter, CA). Proteins were suspended in ACN 3% / TFA 0.1% and separated on a C18 non-porous reversed phase column. The separation was performed via different gradient elution of two solvents: distilled water/TFA 0.1% and ACN / TFA 0.08% at a constant flow rate of 0.75 mL/min and proteins were monitored at 214 nm. Values correspond to results shown in Table 1. (B) The protein mixture (1 µg of each protein) was separated five times consecutively on the same column and under the same conditions to evaluate the reproducibility of the system. Values correspond to results shown in Table 1. (C) UV214 nm detection sensitivity from 5 µg to 100 ng of a 9 protein mixture; from 50 ng to 5 ng of bovine insulin shown in inset.
Figure 2
Figure 2. Separation of a protein standard mixture by SDS-PAGE electrophoresis
Samples containing 1 µg and 100 ng of each protein standard were separated on a 10% Bis-Tris SDS-PAGE electrophoresis gel at 150 V until complete. Proteins were stained with Imperial Protein Stain for 4 h and de-stained overnight in distilled water. Proteins correspond to those analyzed by np-RP HPLC shown in Figure 1 and Table 1.
Figure 3
Figure 3. MALDI-TOF MS analyses of the 9 protein mixture after np-RP HPLC separation
The protein mixture (1 µg of each protein) was separated by np-RP HPLC. 24 fractions were collected from 14 to 20 min into a 96-well plate and subjected either to intact MALDI-TOF MS (A) or to peptide mass mapping after tryptic digestion (B). Each MALDI-TOF spectrum corresponds to an individual fraction. Table 2 provides intact molecular weight information and PMF database search results and sequence coverage for each protein.
Figure 4
Figure 4. MALDI-TOF MS analyses of np-RP HPLC separated intact insulin
Decreasing amounts of the protein standard were separated by np-RP HPLC and fractions corresponding to insulin (13.75 to 14 min) were dried and analyzed by MALDI-TOF MS. Sensitivity of detection as shown was of the order of 50 pg.
Figure 5
Figure 5. MALDI-TOF MS analyses of tryptic peptides from the np-RP HPLC fraction corresponding to cytochrome C
Decreasing amounts of the protein standard were separated by np-RP HPLC and fractions corresponding to cytochrome C were collected, dried and digested with trypsin. Resulting peptides were analyzed by MALDI-TOF MS. Mass values shown correspond to theoretical peptides of cytochrome C; numbers indicate sequence. Inset shows m/z values for decreasing amounts of tryptic peptides from cytochrome C (50 ng–500 pg).
Figure 6
Figure 6. In-well versus in-gel digestion of separated proteins
Cytochrome C (A and B) and catalase (C and D) (1 µg or 100 ng) were separated from the whole protein standard by either by np-RP HPLC or by SDS-PAGE electrophoresis. Corresponding fractions or bands were respectively in-well or in-gel digested with trypsin and resulting peptides were analyzed by MALDI-TOF MS. Spectra corresponding to peptides from cytochrome C and catalase were aligned and peaks which matched the theoretical digest of the protein are highlighted (●) for each protein. Values correspond to results shown in Table 2.
Figure 7
Figure 7. Endothelial cell membrane protein fraction separation by np-RP HPLC: UV214 nm and intact protein MS results
100 µg of bovine endothelial cell membrane mixture were separated by np-RP HPLC. (A) Chromatogram from HPLC: UV214 nm. Twenty four fractions were analyzed either by intact MALDI-TOF MS or by peptide mass mapping. In-well trypsin digested fractions were spotted on a MALDI target and analyzed by MALDI-TOF MS. A list of the peaks corresponding to each spectrum was generated by MoverZ software (ProteoMetrics) and then submitted to Mascot (Matrixscience) database search software for protein identification. (B) MALDI-TOF MS results. The most abundant proteins are plotted following the retention time of the fractions where they were identified, corresponding to the HPLC UV-trace. (C) Intact endothelial cell membrane proteins observed by MALDI-TOF MS. Twenty four fractions collected after np-RP HPLC from 16 to 24 minutes were spotted on a MALDI target and analyzed by intact protein MALDI-TOF MS. Spectra are presented using SigmaPlot software (Systat Software Inc.). (i) Spectra recorded over the range m/z 5,000 to 25,000. (ii) Spectra recorded over the range m/z 25,000 to 80,000. Peptide mass fingerprint database search results and intact protein mass values are found in Table 3.

References

    1. Tyers M, Mann M. Nature. 2003;422:193–197. - PubMed
    1. Pandey A, Mann M. Nature. 2000;405:837–846. - PubMed
    1. Abbott A. Nature. 1999;402:715–720. - PubMed
    1. Venter JC, Adams MD, Myers EW, Li PW, et al. Science. 2001;291:1304–1351. - PubMed
    1. Aebersold R, Mann M. Nature. 2003;422:198–207. - PubMed

Publication types

MeSH terms