. 2007 Jan;41(1):63-76.
doi: 10.1016/j.ceca.2006.05.001. Epub 2006 Jul 7.

Ca2+ refilling of the endoplasmic reticulum is largely preserved albeit reduced Ca2+ entry in endothelial cells

Affiliations

Ca2+ refilling of the endoplasmic reticulum is largely preserved albeit reduced Ca2+ entry in endothelial cells

R Malli et al. Cell Calcium. 2007 Jan.

Abstract

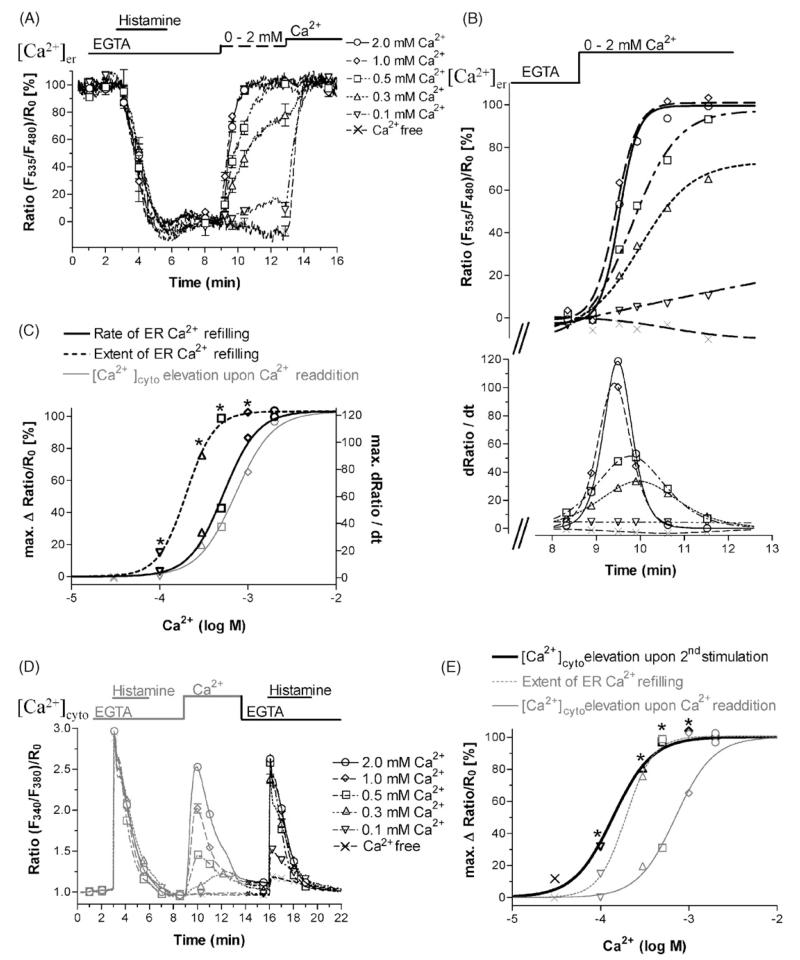
In this study the relationship between the efficiency of endoplasmic reticulum (ER) Ca2+ refilling and the extent of Ca2+ entry was investigated in endothelial cells. ER and mitochondrial Ca2+ concentration were measured using genetically encoded Ca2+ sensors, while the amount of entering Ca2+ was controlled by varying either the extracellular Ca2+ or the electrical driving force for Ca2+ by changing the plasma membrane potential. In the absence of an agonist, ER Ca2+ replenishment was fully accomplished even if the Ca2+ concentration applied was reduced from 2 to 0.5mM. A similar strong efficiency of ER Ca2+ refilling was obtained under condition of plasma membrane depolarization. However, in the presence of histamine, ER Ca2+ refilling depended on mitochondrial Ca2+ transport and was more susceptible to membrane depolarization. Store-operated Ca2+ entry (SOCE), was strongly reduced under low Ca2+ and depolarizing conditions but increased if ER Ca2+ uptake was blocked or if ER Ca2+ was released continuously by IP(3). A correlation of the kinetics of ER Ca2+refilling with cytosolic Ca2+ signals revealed that termination of SOCE is a rapid event that is not delayed compared to ER refilling. Our data indicate that ER refilling occurs in priority to, and independently from the cytosolic Ca2+ elevation upon Ca2+ entry and that this important process is widely achieved even under conditions of diminished Ca2+entry.


Figures

Fig. 1
Fig. 1
Modulation of store-operated Ca2+ entry (SOCE) by membrane depolarization or decreased extracellular Ca2+ concentration. Cytosolic Ca2+ signals were recorded using fura-2. In order to deplete the ER, cells were stimulated with 100 μM histamine in the absence of extracellular Ca2+. As a measure of SOCE, cytosolic Ca2+ elevation upon Ca2+ re-addition after agonist washout was obtained. (A) To induce plasma membrane depolarization, extracellular K+ concentration was increased from 5 to 130 mM 2 min prior Ca2+ re-addition (filled symbols, dotted line, n = 47). For comparison, experiments in physiological medium (i.e. 5 mM K+) are shown (open symbols, continuous line, n = 43). *P < 0.05 vs. control. (B) Left panel: as indicated, different Ca2+ concentrations ranging from nominal Ca2+-free to 2 mM Ca2+ were added (n = 32–91). Right panel: concentration–response curve of the cytosolic Ca2+ elevation achieved by the various extracellular Ca2+ buffers. (C) Left panel: a comparison of the effect of membrane depolarization with that of various extracellular Ca2+ concentration (values are expressed in percentage while the maximal effect under control conditions was set to 100%). Right panel: schematic illustration of the three experimental conditions: maximal [Ca2+]cyto elevation was obtained in normal K+-containing buffer and addition of 2 mM Ca2+ (a, control), reduced extracellular Ca2+ in normal K+-containing buffer (b, low [Ca2+]e) and depolarizing conditions in normal Ca2+-containing solution but high extracellular K+ (c, 130 mM K+).
Fig. 2
Fig. 2
ER Ca2+ refilling is largely preserved under conditions of membrane depolarization. (A) Following the experimental protocol shown in Fig. 1A in which the ER of pre-stimulated cells was refilled by the addition of 2 mM Ca2+ in physiological extracellular K+ (i.e. 5 mM K+, open symbols, continuous line, n = 43) or under high extracellular K+ conditions (i.e. 130 mM K+, filled symbols, dotted line, n = 47) (grey in the present figure), ER Ca2+ content was estimated by a further stimulation with 100 μM histamine in the absence of extracellular Ca2+. *P < 0.05 vs. cytosolic Ca2+ elevation upon Ca2+ re-addition (grey line). (B) In EA.hy 926 cells that were transiently transfected with vYC4er, ER Ca2+ content was monitored upon stimulation with 100 μM histamine followed by Ca2+ refilling after agonist washout under control conditions (open symbols, continuous line, n = 12) and in high K+-containing buffer (filled symbols, dotted line, n = 15).
Fig. 3
Fig. 3
ER Ca2+ refilling is largely assured even under conditions of reduced Ca2+ influx. (A) The impact of the concentration of extracellular Ca2+ on ER Ca2+ refilling was assessed in cells transiently transfected with YC4er (n = 6–15). (B) Calculation of the rate of ER Ca2+ refilling from the external Ca2+ concentration. The kinetics of ER Ca2+ loading under conditions with different external Ca2+ concentrations were fitted according to a Boltzmann sigmoid curve (upper panel) and used to calculate the derivation dRatio/dt. (C) Concentration–response curves of the rate (bold line, n = 6–15) and extent of ER Ca2+ refilling (bold dotted line, n = 6–15) and [Ca2+]cyto elevation (grey line and symbols; Fig. 1C) upon Ca2+ re-addition. (D) After addition of different extracellular Ca2+ concentration (nominal Ca2+ free to 2 mM) to pre-stimulated cells (grey lines represent this protocol already described under Fig. 1B), cells were stimulated a second time with 100 μM histamine in the absence of extracellular Ca2+ (n = 32–91). (E) Concentration–response curves of the second histamine-induced cytosolic Ca2+ elevation (bold continuous line) compared with recurrences of the ER Ca2+ refilling (grey dotted line) and [Ca2+]cyto elevation upon Ca2+ re-addition (grey continuous line). *P < 0.05 vs. cytosolic Ca2+ elevation upon Ca2+ re-addition (grey line).
Fig. 4
Fig. 4
Entering Ca2+ is directed towards the cytosol upon SERCA inhibition. (A) The impact of SERCA inhibition with 15 μM BHQ on intracellular Ca2+ mobilization to 100 μM histamine followed by an addition of 2 mM extracellular Ca2+ in high K+-containing buffer. [Ca2+]cyto signals were assessed in fura-2 loaded cells. Traces represent average curves of 15 measurement in the absence of BHQ (filled symbols, continuous line) and 63 recordings in the presence of BHQ (open symbols, dotted line). *P < 0.05 vs. in the absence of BHQ. (B) Left panel: in low K+ medium (i.e. 5 mM), different extracellular Ca2+ concentration ranging from nominal free Ca2+ to 2 mM were added to pre-stimulated cells in the continuous presence of 15 μM BHQ (n = 29–45). Right panel: the peak magnitudes reached upon the addition of given extracellular Ca2+ concentration in the presence of BHQ were normalized to the maximal amplitude and used for calculation of a concentration–response curve. For comparison replications from Fig. 1D and C are presented as grey curves. *P < 0.05 vs. cytosolic Ca2+ elevation upon Ca2+ re-addition in the absence of BHQ (grey line).
Fig. 5
Fig. 5
A trans-ER Ca2+ flux maintains increased [Ca2+]cyto levels under depolarizing conditions. (A) 2 mM extracellular Ca2+ were added to pre-stimulated cells (100 μM histamine) in the continuous presence of the agonist under conditions of physiological extracellular K+ (i.e. 5 mM K+, open circles, continuous line, n = 45) or in the presence of high extracellular K+ (i.e. 130 mM K+, closed circles, dotted line, n = 59), while [Ca2+]cyto signals were recorded using fura-2. Alternatively histamine was removed before 2 mM Ca2+ was readded in the presence of 130 mM extracellular K+ (filled squares, dashed line, n = 15). *P < 0.05 vs. control. #P < 0.05 vs. in the absence of histamine. (B) Left panel: as indicated, cells were stimulated with 100 μM histamine in the presence of 2 mM extracellular Ca2+ under conditions of low extracellular K+ (i.e. 5 mM K+, open symbols, continuous line, n = 43) or in high extracellular K+ buffer (i.e. 130 mM K+, filled symbols, dotted line, n = 41). *P < 0.05 vs. control. Right panel: cells transiently transfected with D1ER were used to investigate changes of the ER Ca2+ content upon stimulation with 100 μM histamine in low extracellular K+ buffer (i.e. 5 mM K+, open symbols, continuous line, n = 13) and high extracellular K+ medium (i.e. 130 mM K+, filled symbols, dotted line, n = 17). *P < 0.05 vs. control.
Fig. 6
Fig. 6
Two routes for ER Ca2+ refilling. (A) Cells expressing RP-mt were used to measure mitochondrial Ca2+ sequestration upon Ca2+ re-addition in the presence of 100 μM histamine under conditions of physiological (i.e. 5 mM; n = 8) and high (i.e. 130 mM; n = 22) external K+. (B) Cells were transiently transfected with D1ER and ER replenishment was monitored upon Ca2+ re-addition in the presence of 100 μM histamine under conditions of physiological (n = 6) and high (n = 5) external K+. (C) Schematic illustration of the two different Ca2+ paths that achieve ER Ca2+ refilling upon Ca2+ re-addition after agonist washout in physiological K+ (I) or high K+ buffer (II), and in the presence of histamine in physiological K+ (III) or high K+ buffer (IV). Accordingly, the respective conditions are indicated in (A) and (B) and Fig. 2B.
Fig. 7
Fig. 7
Termination of SOCE. (A) ER Ca2+ stores were emptied by application of 15 μM BHQ, and 2 mM Ca2+ was then readded in high K+ buffer (130 mM K+). After 4 min, the medium was switched to physiological K+ concentration (5 mM K+) (n = 14). (B) ER Ca2+ stores were emptied by the application of 100 μM histamine and after the agonist washout, 2 mM Ca2+ were readded in high K+ buffer (130 mM K+). After 3 min, the medium was switched to physiological K+ concentration (5 mM K+) (n = 10). (C) The inset represents the protocol used to evaluate the termination of SOCE. After ER depletion, 2 mM Ca2+ were readded in high K+ buffer (130 mM K+), and after different time points (15 and 45 s are represented), the medium was switched to normal K+ concentration (5 mM K+). Columns represents the statistic evaluation of the impact of reducing the K+ concentration to normal level (5 mM K+) at different time points (15, 20, 30 and 45 s) after Ca2+ re-addition (n = 16–48).

Similar articles

Cited by

References

    1. Berridge MJ. Inositol trisphosphate and calcium signalling. Nature. 1993;361:315–325. - PubMed
    1. Parekh AB, Putney JWJ. Store-operated calcium channels. Physiol. Rev. 2005;85:757–810. - PubMed
    1. Putney JW., Jr. A model for receptor-regulated calcium entry. Cell Calcium. 1986;7:1–12. - PubMed
    1. Putney JW., Jr. Capacitative calcium entry revisited. Cell Calcium. 1990;11:611–624. - PubMed
    1. Abad MF, Di Benedetto G, Magalhaes PJ, Filippin L, Pozzan T. Mitochondrial pH monitored by a new engineered green fluorescent protein mutant. J. Biol. Chem. 2004;279:11521–11529. - PubMed

Publication types

MeSH terms

Substances