ROC curves predicted by a model of visual search
- PMID: 16825743
- PMCID: PMC2230636
- DOI: 10.1088/0031-9155/51/14/013
ROC curves predicted by a model of visual search
Abstract
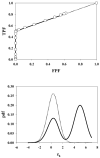
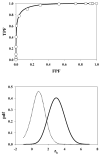
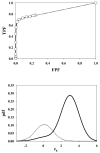
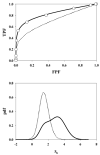
In imaging tasks where the observer is uncertain whether lesions are present, and where they could be present, the image is searched for lesions. In the free-response paradigm, which closely reflects this task, the observer provides data in the form of a variable number of mark-rating pairs per image. In a companion paper a statistical model of visual search has been proposed that has parameters characterizing the perceived lesion signal-to-noise ratio, the ability of the observer to avoid marking non-lesion locations, and the ability of the observer to find lesions. The aim of this work is to relate the search model parameters to receiver operating characteristic (ROC) curves that would result if the observer reported the rating of the most suspicious finding on an image as the overall rating. Also presented are the probability density functions (pdfs) of the underlying latent decision variables corresponding to the highest rating for normal and abnormal images. The search-model-predicted ROC curves are 'proper' in the sense of never crossing the chance diagonal and the slope is monotonically changing. They also have the interesting property of not allowing the observer to move the operating point continuously from the origin to (1, 1). For certain choices of parameters the operating points are predicted to be clustered near the initial steep region of the curve, as has been observed by other investigators. The pdfs are non-Gaussians, markedly so for the abnormal images and for certain choices of parameter values, and provide an explanation for the well-known observation that experimental ROC data generally imply a wider pdf for abnormal images than for normal images. Some features of search-model-predicted ROC curves and pdfs resemble those predicted by the contaminated binormal model, but there are significant differences. The search model appears to provide physical explanations for several aspects of experimental ROC curves.
Figures


Similar articles
-
A bivariate contaminated binormal model for robust fitting of proper ROC curves to a pair of correlated, possibly degenerate, ROC datasets.Med Phys. 2017 Jun;44(6):2207-2222. doi: 10.1002/mp.12263. Epub 2017 May 18. Med Phys. 2017. PMID: 28382718
-
Recent advances in observer performance methodology: jackknife free-response ROC (JAFROC).Radiat Prot Dosimetry. 2005;114(1-3):26-31. doi: 10.1093/rpd/nch512. Radiat Prot Dosimetry. 2005. PMID: 15933077
-
A search model and figure of merit for observer data acquired according to the free-response paradigm.Phys Med Biol. 2006 Jul 21;51(14):3449-62. doi: 10.1088/0031-9155/51/14/012. Epub 2006 Jul 6. Phys Med Biol. 2006. PMID: 16825742 Free PMC article.
-
Unified measurement of observer performance in detecting and localizing target objects on images.Med Phys. 1996 Oct;23(10):1709-25. doi: 10.1118/1.597758. Med Phys. 1996. PMID: 8946368 Review.
-
The value of observer performance studies in dose optimization: a focus on free-response receiver operating characteristic methods.J Nucl Med Technol. 2013 Jun;41(2):57-64. doi: 10.2967/jnmt.112.116566. Epub 2013 Apr 26. J Nucl Med Technol. 2013. PMID: 23625536 Review.
Cited by
-
Bias, underestimation of risk, and loss of statistical power in patient-level analyses of lesion detection.Eur Radiol. 2010 Mar;20(3):584-94. doi: 10.1007/s00330-009-1590-4. Epub 2009 Sep 16. Eur Radiol. 2010. PMID: 19763582
-
New developments in observer performance methodology in medical imaging.Semin Nucl Med. 2011 Nov;41(6):401-18. doi: 10.1053/j.semnuclmed.2011.07.001. Semin Nucl Med. 2011. PMID: 21978444 Free PMC article. Review.
-
Correlation of free-response and receiver-operating-characteristic area-under-the-curve estimates: results from independently conducted FROC∕ROC studies in mammography.Med Phys. 2012 Oct;39(10):5917-29. doi: 10.1118/1.4747262. Med Phys. 2012. PMID: 23039631 Free PMC article.
-
A brief history of free-response receiver operating characteristic paradigm data analysis.Acad Radiol. 2013 Jul;20(7):915-9. doi: 10.1016/j.acra.2013.03.001. Epub 2013 Apr 12. Acad Radiol. 2013. PMID: 23583665 Free PMC article. Review.
-
Spatial localization accuracy of radiologists in free-response studies: Inferring perceptual FROC curves from mark-rating data.Acad Radiol. 2007 Jan;14(1):4-18. doi: 10.1016/j.acra.2006.10.015. Acad Radiol. 2007. PMID: 17178361 Free PMC article.
References
-
- Berbaum KS, Franken EA, Dorfman DD, Rooholamini SA, Kathol MH, Barloon TJ, Behlke FM, Sato Y, Lu CH, El-Khoury GY, Flickinger FW, Montgomery WJ. Invest Radiol. 1990;25:133–140. - PubMed
-
- Bunch PC, Hamilton JF, Sanderson GK, Simmons AH. J of Appl Photogr Eng. 1978;4:166–171.
-
- Chakraborty DP. Submitted to Physics of Medicine and Biology. 2006. Feb 2,
-
- Chakraborty DP, Berbaum KS. Medical Physics. 2004;31:2313–2330. - PubMed
-
- Dorfman DD, Alf E., Jr Journal of Mathematical Psychology. 1969;6:487–496.
Publication types
MeSH terms
Grants and funding
LinkOut - more resources
Full Text Sources
Other Literature Sources
