

Genomewide association analysis of human narcolepsy and a new resistance gene
- PMID: 16826516
- PMCID: PMC1559501
- DOI: 10.1086/505539
Genomewide association analysis of human narcolepsy and a new resistance gene
Abstract
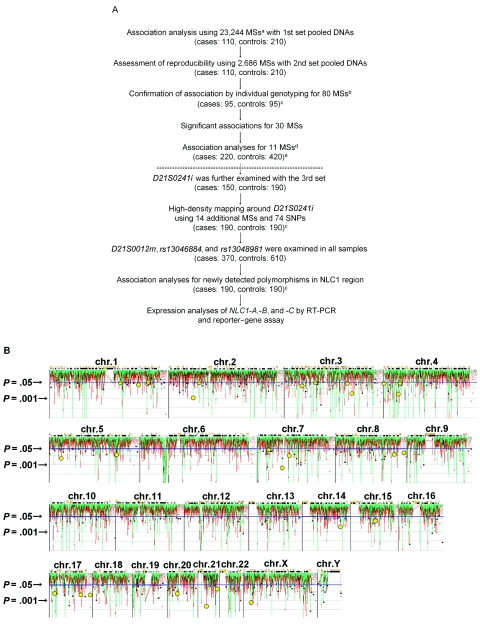
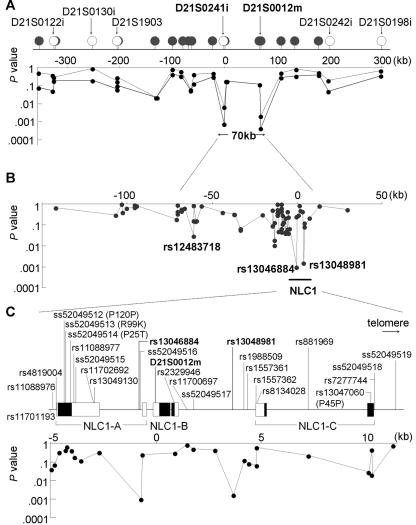
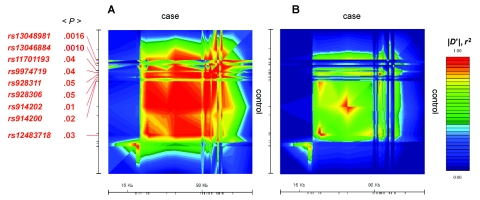
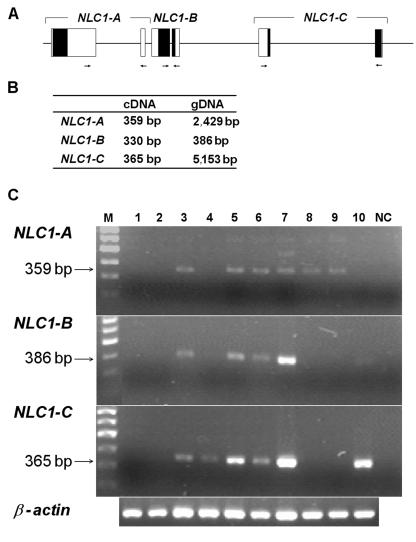
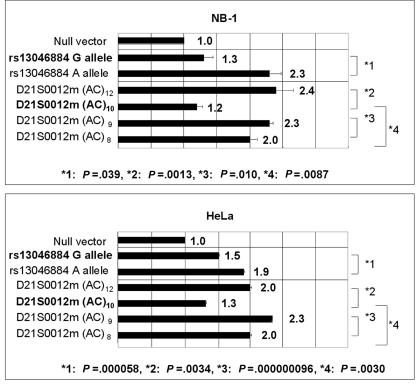
Human narcolepsy is a hypersomnia that is affected by multiple genetic and environmental factors. One genetic factor strongly associated with narcolepsy is the HLA-DRB1*1501-DQB1*0602 haplotype in the human leukocyte antigen region on chromosome 6, whereas the other genetic factors are not clear. To discover additional candidate regions for susceptibility or resistance to human narcolepsy, we performed a genomewide association study, using 23,244 microsatellite markers. Two rounds of screening with the use of pooled DNAs yielded 96 microsatellite markers (including 16 markers on chromosome 6) with significantly different estimated frequencies in case and control pools. Markers not located on chromosome 6 were evaluated by the individual typing of 95 cases and 95 controls; 30 markers still showed significant associations. A strong association was displayed by a marker on chromosome 21 (21q22.3). The surrounding region was subjected to high-density association mapping with 14 additional microsatellite markers and 74 SNPs. One microsatellite marker (D21S0012m) and two SNPs (rs13048981 and rs13046884) showed strong associations (P < .0005; odds ratios 0.19-0.33). These polymorphisms were in a strong linkage disequilibrium, and no other polymorphism in the region showed a stronger association with narcolepsy. The region contains three predicted genes--NLC1-A, NLC1-B, and NLC1-C--tentatively named "narcolepsy candidate-region 1 genes," and NLC1-A and NLC1-C were expressed in human hypothalamus. Reporter-gene assays showed that the marker D21S0012m in the promoter region and the SNP rs13046884 in the intron of NLC1-A significantly affected expression levels. Therefore, NLC1-A is considered to be a new resistance gene for human narcolepsy.
Figures
Similar articles
-
Analysis of extended HLA haplotypes in multiple sclerosis and narcolepsy families confirms a predisposing effect for the class I region in Tasmanian MS patients.Immunogenetics. 2007 Mar;59(3):177-86. doi: 10.1007/s00251-006-0183-5. Epub 2007 Jan 26. Immunogenetics. 2007. PMID: 17256150
-
Identification of a telomeric boundary of the HLA region with potential for predisposition to human narcolepsy.Immunogenetics. 2000 Nov;52(1-2):12-8. doi: 10.1007/s002510000245. Immunogenetics. 2000. PMID: 11132147
-
Linkage of human narcolepsy with HLA association to chromosome 4p13-q21.Genomics. 2000 Apr 1;65(1):84-6. doi: 10.1006/geno.2000.6143. Genomics. 2000. PMID: 10777671
-
[Genetics of human narcolepsy].Rev Neurol (Paris). 2001 Nov;157(11 Pt 2):S92-6. Rev Neurol (Paris). 2001. PMID: 11924049 Review. French.
-
Genetic and familial aspects of narcolepsy.Neurology. 1998 Feb;50(2 Suppl 1):S16-22. doi: 10.1212/wnl.50.2_suppl_1.s16. Neurology. 1998. PMID: 9484418 Review.
Cited by
-
Long Non-Coding RNAs: Role in Testicular Cancers.Front Oncol. 2021 Mar 9;11:605606. doi: 10.3389/fonc.2021.605606. eCollection 2021. Front Oncol. 2021. PMID: 33767982 Free PMC article. Review.
-
Genome wide screen identifies microsatellite markers associated with acute adverse effects following radiotherapy in cancer patients.BMC Med Genet. 2010 Aug 11;11:123. doi: 10.1186/1471-2350-11-123. BMC Med Genet. 2010. PMID: 20701746 Free PMC article.
-
Identification of differentially expressed genes in blood cells of narcolepsy patients.Sleep. 2007 Aug;30(8):974-9. doi: 10.1093/sleep/30.8.974. Sleep. 2007. PMID: 17702266 Free PMC article.
-
Detection of genomic variation by selection of a 9 mb DNA region and high throughput sequencing.PLoS One. 2009 Aug 17;4(8):e6659. doi: 10.1371/journal.pone.0006659. PLoS One. 2009. PMID: 19684856 Free PMC article.
-
Exploring the Literature on Narcolepsy: Insights into the Sleep Disorder That Strikes during the Day.NeuroSci. 2023 Oct 12;4(4):263-279. doi: 10.3390/neurosci4040022. eCollection 2023 Dec. NeuroSci. 2023. PMID: 39484177 Free PMC article. Review.
References
Web Resources
-
- Celera database, http://www.celera.com/
-
- GOLD program, http://www.sph.umich.edu/csg/abecasis/GOLD/
-
- HapMap, http://www.hapmap.org/
-
- MOTIF, http://motif.genome.ad.jp/
References
-
- Honda Y, Matsuki K (1979) Census of narcolepsy, cataplexy and sleep life among teen-agers in Fujisawa city. Sleep Res 8:191
-
- Mignot E (1998) Genetic and familial aspects of narcolepsy. Neurology 50:S16–S22 - PubMed
-
- Juji T, Satake M, Honda Y, Doi Y (1984) HLA antigens in Japanese patients with narcolepsy: all the patients were DR2 positive. Tissue Antigens 24:316–319 - PubMed
Publication types
MeSH terms
Substances
LinkOut - more resources
Full Text Sources
Other Literature Sources
Research Materials
