. 2006 Aug;79(2):313-22.
doi: 10.1086/506276. Epub 2006 Jun 28.

A coalescence-guided hierarchical Bayesian method for haplotype inference

Affiliations

A coalescence-guided hierarchical Bayesian method for haplotype inference

Yu Zhang et al. Am J Hum Genet. 2006 Aug.

Abstract

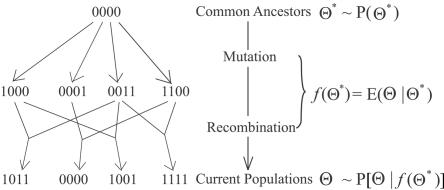
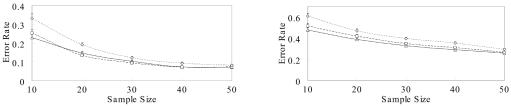
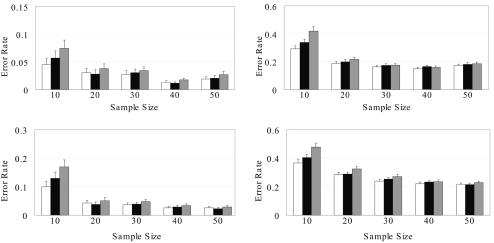
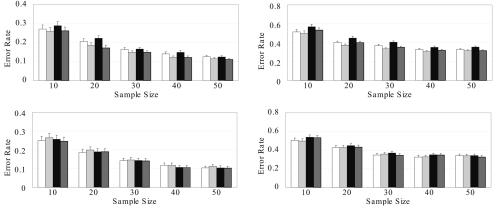
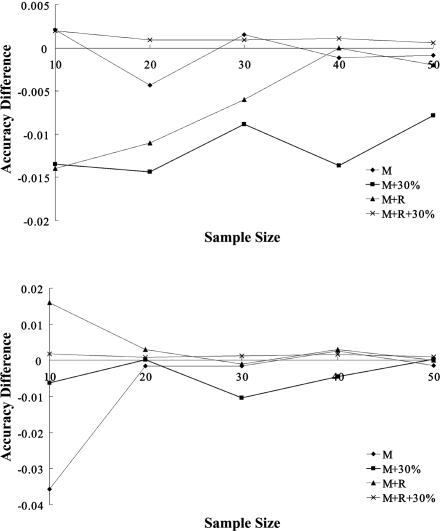
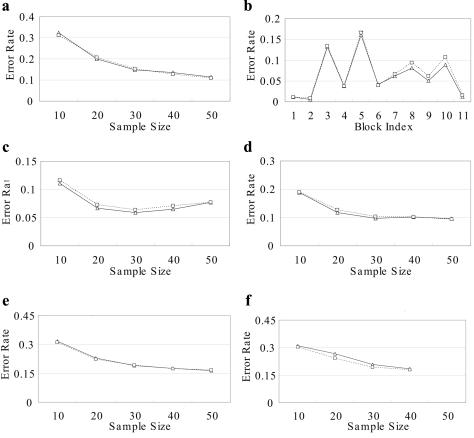
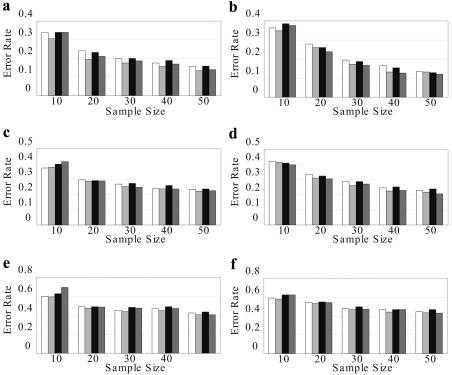
Haplotype inference from phase-ambiguous multilocus genotype data is an important task for both disease-gene mapping and studies of human evolution. We report a novel haplotype-inference method based on a coalescence-guided hierarchical Bayes model. In this model, a hierarchical structure is imposed on the prior haplotype frequency distributions to capture the similarities among modern-day haplotypes attributable to their common ancestry. As a consequence, the model both allows distinct haplotypes to have different a priori probabilities according to the inferred hierarchical ancestral structure and results in a proper joint posterior distribution for all the parameters of interest. A Markov chain-Monte Carlo scheme is designed to draw from this posterior distribution. By using coalescence-based simulation and empirically generated data sets (Whitehead Institute's inflammatory bowel disease data sets and HapMap data sets), we demonstrate the merits of the new method in comparison with HAPLOTYPER and PHASE, with or without the presence of recombination hotspots and missing genotypes.


Figures

Figure  1.
Figure 1.
Schematic diagram of CHB. Hyperparameter Θ* represents the frequencies of ancestral haplotypes from which the current samples are descended. Assuming a robust star-like topology, we derive the prior expectation of the modern-day haplotype frequencies, Θ, as f*), which takes into consideration both mutation and recombination events. Each haplotype consists of four SNPs, with 0 and 1 indicating the two alternative alleles.
Figure  2.
Figure 2.
Mean error rates of CHB-NR (triangles), PHASE-NR (squares), and HAPLOTYPER (diamonds), for coalescence-based simulation data sets with no missing genotypes (left panel) or 30% missing genotypes (right panel).
Figure  3.
Figure 3.
Mean error rates and SEs of CHB-NR (white), PHASE-NR (black), and HAPLOTYPER (gray), for Whitehead IBD data sets with no missing genotypes (left panel) or 30% missing genotypes (right panel).
Figure  4.
Figure 4.
Mean error rates and SEs of CHB-NR (white), PHASE-NR (black), and HAPLOTYPER (gray), for HapMap data sets without recombination and with no missing genotypes (left panels) or 30% missing genotypes (right panels). Upper panels, European ancestry. Lower panels, African ancestry.
Figure  5.
Figure 5.
Mean error rates and SEs of CHB-NR (white), CHB-R (light gray), PHASE-NR (black), and PHASE-R (dark gray), for HapMap data sets with recombination hotspots and with no missing genotypes (left panels) or 30% missing genotypes (right panels). Upper panels, European ancestry. Lower panels, African ancestry.
Figure  6.
Figure 6.
CHB recombination estimation (upper panel) compared with the HapMap report of recombination rates for 1,081 SNPs across a 3-Mb region (lower panel). The upper panel displays the estimated average recombination probabilities across four populations from the HapMap project. Only values >0.1, which correspond to the highest 10% of recombination probabilities, are shown.
Figure  B1.
Figure B1.
Difference of phasing accuracy by running PHASE with 10 times number of iterations. M = mutation-only data; M+R = data in which both mutation and recombination are involved; +30% = data sets with 30% missing genotypes. Upper panel, HapMap data sets with European ancestry. Lower panel, HapMap data sets with African ancestry.
Figure  B2.
Figure B2.
Comparison between CHB-NR (triangles) and PHASE-NR (squares) on coalescence-based simulated data set (a), Whitehead IBD data set (b), and two HapMap data sets with no recombination: CEU (c) and YRI (d). In addition, the comparison between CHB-R (triangles) and PHASE-R (squares) of data sets with recombination hotspots is shown for CEU (e) and YRI (f). From each data set, 10% of genotypes were randomly removed.
Figure  B3.
Figure B3.
Comparison among CHB-NR (white), PHASE-NR (black), and HAPLOTYPER (gray) on TAP2 data sets with no missing genotypes (left panel) or 30% missing genotypes (right panel).
Figure  B4.
Figure B4.
Comparison between CHB-NR (triangles), PHASE-NR (squares) and HAPLOTYPER (diamonds) on HapMap data sets with no recombinations from different populations: a, Han Chinese population with no missing genotypes; b, Japanese population with no missing genotypes; c, Han Chinese population with 10% missing genotypes; d, Japanese population with 10% missing genotypes; e, Han Chinese population with 30% missing genotypes; f, Japanese population with 30% missing genotypes.
Figure  B5.
Figure B5.
Comparison between CHB-NR (white), CHB-R (light gray), PHASE-NR (black) and PHASE-R (dark gray) on HapMap data sets with recombination hotspots from different populations: a, Han Chinese population with no missing genotypes; b, Japanese population with no missing genotypes; c, Han Chinese population with 10% missing genotypes; d, Japanese population with 10% missing genotypes; e, Han Chinese population with 30% missing genotypes; f, Japanese population with 30% missing genotypes.
Figure  B6.
Figure B6.
Comparison between CHB-NR (white), CHB-R (light gray), PHASE-NR (black), and PHASE-R (dark gray) on HapMap data sets with moderate recombinations from different populations: a, European population with no missing genotypes; b, African population with no missing genotypes; c, European population with 10% missing genotypes; d, African population with 10% missing genotypes; e, European population with 30% missing genotypes; f, African population with 30% missing genotypes.

References

Web Resources

    1. Coalescence-guided Hierarchical Bayesian Model for Haplotype Inference, http://www.people.fas.harvard.edu/~junliu/chb/ (for supplementary materials, detailed documentation, and download instructions for CHB algorithm)
    1. International HapMap Project, http://www.hapmap.org/
    1. ms: A program for generating samples under neutral models, http://home.uchicago.edu/~rhudson1/source/mksamples.html (for Hudson's program)

References

    1. International HapMap Consortium (2003) The International HapMap Project. Nature 426:789–79610.1038/nature02168 - DOI - PubMed
    1. International HapMap Consortium (2005) A haplotype map of the human genome. Nature 437:1299–132010.1038/nature04226 - DOI - PMC - PubMed
    1. Akey J, Jin L, Xiong M (2001) Haplotypes vs single marker linkage disequilibrium tests: what do we gain? Eur J Hum Genet 9:291–30010.1038/sj.ejhg.5200619 - DOI - PubMed
    1. Schaid DJ (2004) Evaluating associations of haplotypes with traits. Genet Epidemiol 27:348–36410.1002/gepi.20037 - DOI - PubMed
    1. Clark AG (2004) The role of haplotypes in candidate gene studies. Genet Epidemiol 27:321–33310.1002/gepi.20025 - DOI - PubMed

Publication types