Comparative Study
. 2006 Jul 10:6:180.
doi: 10.1186/1471-2407-6-180.

The 5'-end transitional CpGs between the CpG islands and retroelements are hypomethylated in association with loss of heterozygosity in gastric cancers

Affiliations
Comparative Study

The 5'-end transitional CpGs between the CpG islands and retroelements are hypomethylated in association with loss of heterozygosity in gastric cancers

Young-Ho Kim et al. BMC Cancer. .

Abstract

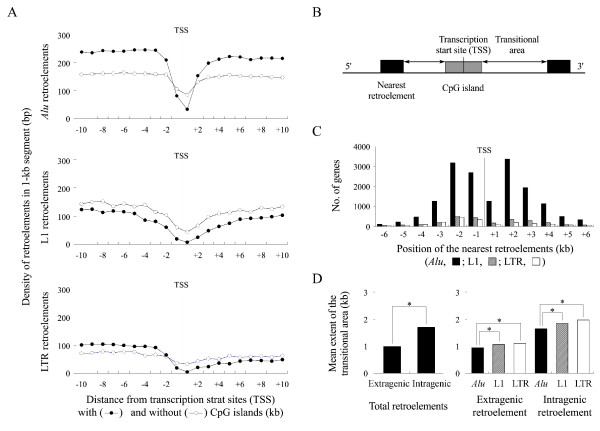
Background: A loss of heterozygosity (LOH) represents a unilateral chromosomal loss that reduces the dose of highly repetitive Alu, L1, and LTR retroelements. The aim of this study was to determine if the LOH events can affect the spread of retroelement methylation in the 5'-end transitional area between the CpG islands and their nearest retroelements.

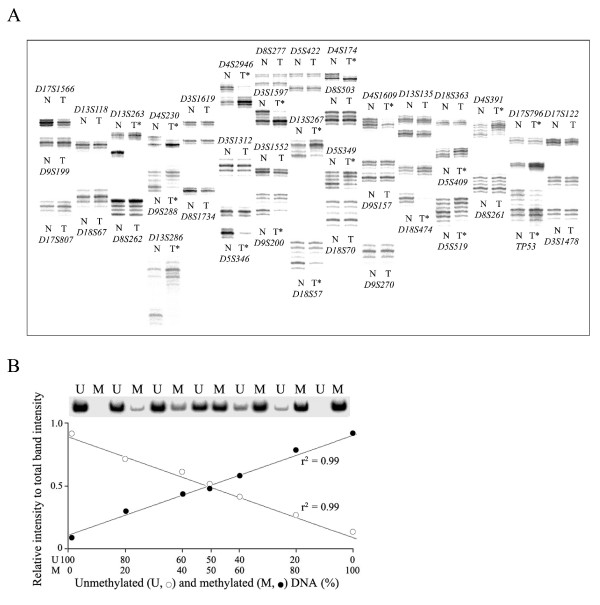
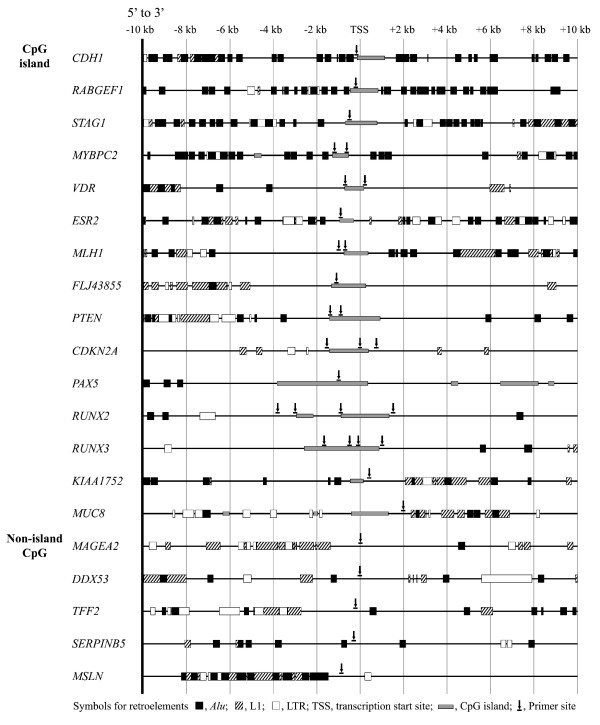
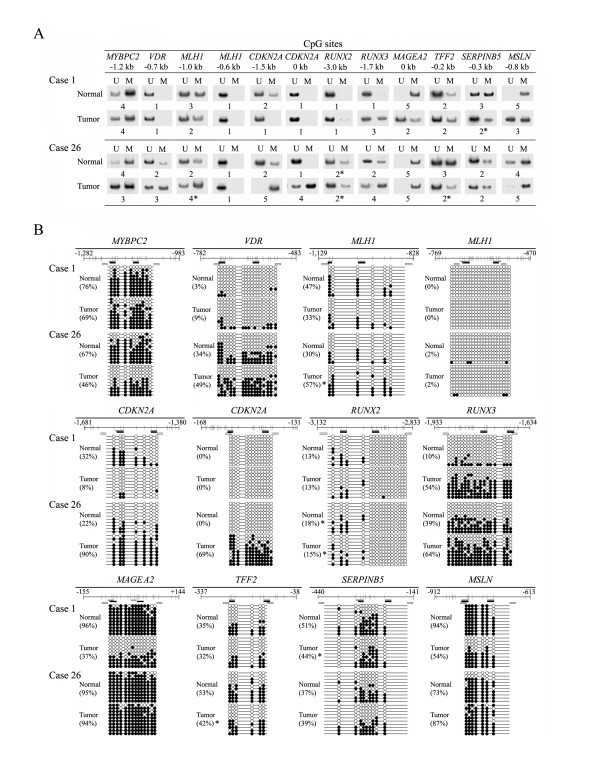
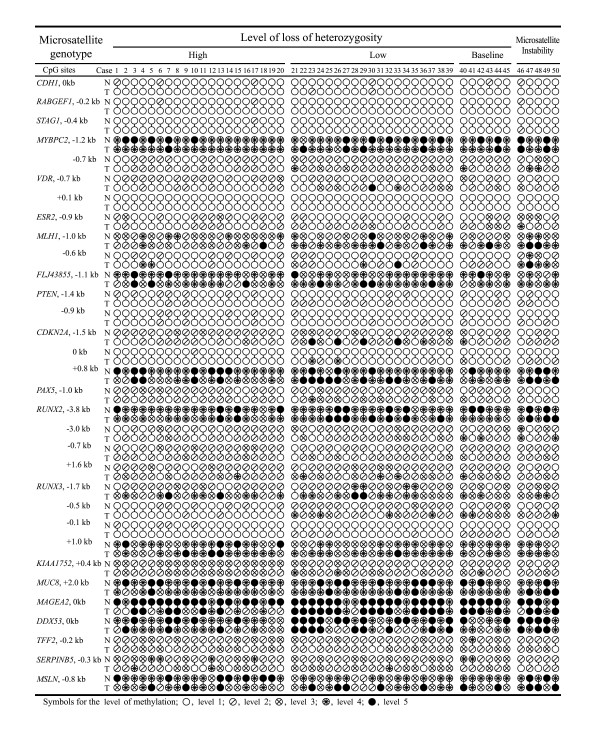
Methods: The 5'-transitional area of all human genes (22,297) was measured according to the nearest retroelements to the transcription start sites. For 50 gastric cancer specimens, the level of LOH events on eight cancer-associated chromosomes was estimated using the microsatellite markers, and the 5'-transitional CpGs of 20 selected genes were examined by methylation analysis using the bisulfite-modified DNA.

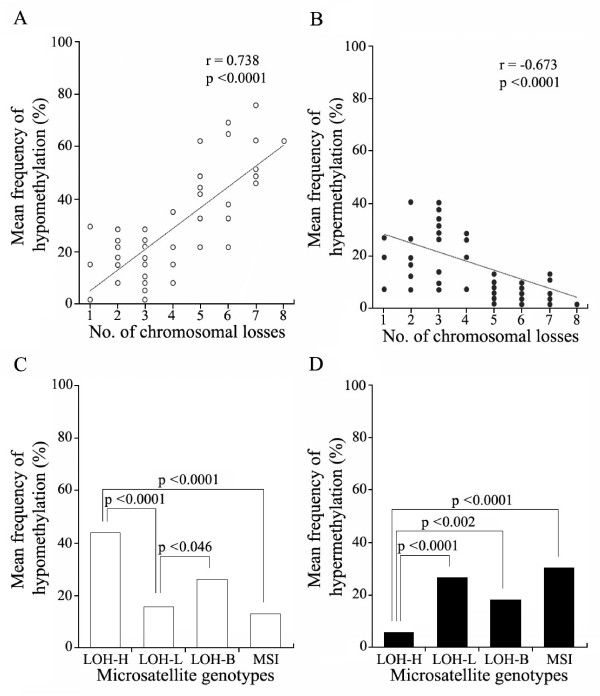
Results: The extent of the transitional area was significantly shorter with the nearest Alu elements than with the nearest L1 and LTR elements, as well as in the extragenic regions containing a higher density of retroelements than in the intragenic regions. The CpG islands neighbouring a high density of Alu elements were consistently hypomethylated in both normal and tumor tissues. The 5'-transitional methylated CpG sites bordered by a low density of Alu elements or the L1 and LTR elements were hypomethylated more frequently in the high-level LOH cases than in the low-level LOH cases.

Conclusion: The 5'-transitional methylated CpG sites not completely protected by the Alu elements were hypomethylated in association with LOH events in gastric cancers. This suggests that an irreversible unbalanced decrease in the genomic dose reduces the spread of L1 methylation in the 5'-end regions of genes.


Figures

Figure 1
Figure 1
Representative autoradiographs of microsatellite analysis (A) and standard curves for methylation and unmethylation MSP amplification (B) using a radioisotope. (A) A "multiplex, hot-start" method was applied to the PCR-based loss of heterozygosity (LOH) analysis. Forty microsatellite allelic loci were amplified in 25 reaction mixtures each of which contained one (10 mixtures) or two (15 mixtures) pairs of primers. A mixture of different-sized two to four amplicons was loaded onto one lane. A total of 80 microsatellite amplicons from each specimen were run simultaneously on one sequencing gel. Case 1 had high-level LOHs involving chromosome 4p, 5q, 9p, 13q, 17p, and 18q. The normal (N) and the corresponding tumor (T) DNAs are indicated above or below each microsatellite amplicon. The asterisk indicates a LOH. (B) The genomic DNA universally methylated by DNA methylase (CpGenome Universal Methylated DNA, Chemicon, Temecula, CA) was used as the methylated control DNA. The PCR DNA, which had been amplified by the universal primer (5'-CCG ACT CGA GNN NNN NAT GTG G-3'), was used as the unmethylated control DNA. Variable mixtures of the two opposite control DNAs according to their PCR intensity of 20 ng/μl were amplified using a set of MSP primers for the non-island CpGs of the TFF2 gene. The proportion of methylated and unmethylated CpGs was calculated using the following formula: Methylation or unmethylation proportion (%) = (methylation or unmethylation intensity/(methylation + unmethylation intensity)) × 100. The relative band intensities of the methylation (M, closed circle) and unmethylation (U, open circle) primer set were plotted as a function of the control DNA content. The amplification intensity ratio of the MSP primer set increased linearly with increasing percentage of the corresponding control DNA in the MSP mixtures.
Figure 2
Figure 2
Schematic diagram of CpG islands and retroelement distributions in the 5'-end regions of 20 genes. A total of 32 CpG amplicon sites from 20 genes were examined using the methylation-specific PCR (MSP) primer sets. The CpG islands of the CDH1, RABGEF1, STAG1, and MYBPC2 genes were neighbored by the high-density Alu elements at distances of ≤ 1 kb. The VDR, ESR2, MLH1, FLJ43855, MYBPC2, PTEN, and CDKN2A genes confronted by a low density of Alu, L1, and LTR elements at a distance of 2–6 kb were examined at the boundary of CpG islands. The PAX5, RUNX2, and RUNX3 genes contained long CpG islands bordered by a few retroelements at distances of > 6 kb. The genes containing no CpG islands are confronted by the L1 elements (MAGEA2 and TFF2), a low density of Alu elements (SERPINB5 and DDX53), or a high density of Alu and L1 elements (MSLN). The VDR, CDKN2A, RUNX2, RUNX3, KIAA1752, and MUC8 genes were examined at the intragenic CpG sites of the CpG islands as well. The MSP primer sites were located in close proximity to the transcription start sites without CpG islands.
Figure 3
Figure 3
Representative autoradiographs of semiquantitative methylation analysis (A) and the number and position of the methylated CpGs identified by the sequencing of common PCR DNA (B). (A) The 5'-transitional CpG sites generated a wide range of methylated and unmethylated PCR band intensities from the bisulfite-modified DNA from Case 1, with a high-level chromosomal loss, and Case 26, with a low-level chromosomal loss. The lanes marked U and M indicate the PCR bands of the unmethylation and methylation primer sets, respectively. The level of the methylated CpGs calculated from a standard MSP curve is indicated below the lanes. (B) For the same cases, the content of methylated CpGs was estimated from the common PCR DNA containing both the methylated and unmethylated CpGs. Ten common PCR clones per DNA sample were sequenced. The content of methylated CpGs is indicated as a percentage on the left side of each CpG methylation map. The different methylation results between the MSP bands and the common PCR DNAs are indicated by an asterisk.
Figure 4
Figure 4
Distributions of the Alu, L1, and LTR retroelements in the 5'-end regions of the human genes. (A) The proportion of Alu, L1, and LTR elements in a 1-kb nucleotide bin were plotted separately in both extragenic and intragenic 10-kb segments. (B) The transitional area is demarcated by the distance between the 5'(3')-end of a CpG island and the extragenic (intragenic) nearest retroelements. The number of genes (C) and the mean extent of the transitional area (D) were calculated according the position and type of the nearest retroelements.
Figure 5
Figure 5
Methylation profiles of the CpG islands and the 5'-transitional CpGs examined in the normal (N) and tumor (T) tissues of gastric cancer patients using semiquantitative methylation-specific PCR analysis. The methylation status was classified into 5 levels. Gastric cancers were classified into four microsatellite genotypes. The level of methylation and the classification of the microsatellite genotypes are detailed in the "Materials and Methods" section. All the information regarding the methylation analysis is listed in table 1 and 2. CpG sites are indicated by the name of the gene and the distance from the transcription start site.
Figure 6
Figure 6
Relationships between methylation alterations and the number of chromosomal losses in gastric cancers. The frequency of hypomethylation (A) and hypermethylation (B) detected in 14 transitional CpG amplicons was plotted as a function of the chromosomal losses. The correlation coefficients were calculated using Pearson's correlation analysis. The correlation between methylation alterations and chromosomal losses is shown with the line of best fit. The mean frequency of hypomethylation (C) and hypermethylation (D) was compared among four microsatellite genotypes.

References

    1. Lasko D, Cavenee W, Nordenskjold M. Loss of constitutional heterozygosity in human cancer. Annu Rev Genet. 1991;25:281–314. doi: 10.1146/annurev.ge.25.120191.001433. - DOI - PubMed
    1. Kern SE, Fearon ER, Tersmette KW, Enterline JP, Leppert M, Nakamura Y, White R, Vogelstein B, Hamilton SR. Clinical and pathological associations with allelic loss in colorectal carcinoma. JAMA. 1989;261:3099–3103. doi: 10.1001/jama.261.21.3099. - DOI - PubMed
    1. Vogelstein B, Fearon ER, Kern SE, Hamilton SR, Preisinger AC, Nakamura Y, White R. Allelotype of colorectal carcinomas. Science. 1989;244:207–211. - PubMed
    1. Choi SW, Choi JR, Chung YJ, Kim KM, Rhyu MG. Prognostic implications of microsatellite genotypes in gastric carcinoma. Int J Cancer. 2000;89:378–383. doi: 10.1002/1097-0215(20000720)89:4<378::AID-IJC10>3.0.CO;2-T. - DOI - PubMed
    1. Choi SW, Lee KJ, Bae YA, Min KO, Kwon MS, Kim KM, Rhyu MG. Genetic classification of colorectal cancer based on chromosomal loss and microsatellite instability predicts survival. Clin Cancer Res. 2002;8:2311–2322. - PubMed

Publication types

MeSH terms