Relation between native ensembles and experimental structures of proteins
- PMID: 16829580
- PMCID: PMC1544146
- DOI: 10.1073/pnas.0511156103
Relation between native ensembles and experimental structures of proteins
Abstract
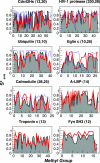
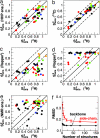
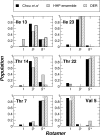
Different experimental structures of the same protein or of proteins with high sequence similarity contain many small variations. Here we construct ensembles of "high-sequence similarity Protein Data Bank" (HSP) structures and consider the extent to which such ensembles represent the structural heterogeneity of the native state in solution. We find that different NMR measurements probing structure and dynamics of given proteins in solution, including order parameters, scalar couplings, and residual dipolar couplings, are remarkably well reproduced by their respective high-sequence similarity Protein Data Bank ensembles; moreover, we show that the effects of uncertainties in structure determination are insufficient to explain the results. These results highlight the importance of accounting for native-state protein dynamics in making comparisons with ensemble-averaged experimental data and suggest that even a modest number of structures of a protein determined under different conditions, or with small variations in sequence, capture a representative subset of the true native-state ensemble.
Conflict of interest statement
Conflict of interest statement: No conflicts declared.
Figures


Similar articles
-
Interpreting dynamically-averaged scalar couplings in proteins.J Biomol NMR. 2005 Aug;32(4):273-80. doi: 10.1007/s10858-005-8873-0. J Biomol NMR. 2005. PMID: 16211481
-
A correspondence between solution-state dynamics of an individual protein and the sequence and conformational diversity of its family.PLoS Comput Biol. 2009 May;5(5):e1000393. doi: 10.1371/journal.pcbi.1000393. Epub 2009 May 29. PLoS Comput Biol. 2009. PMID: 19478996 Free PMC article.
-
Using Pseudocontact Shifts and Residual Dipolar Couplings as Exact NMR Restraints for the Determination of Protein Structural Ensembles.Biochemistry. 2015 Dec 29;54(51):7470-6. doi: 10.1021/acs.biochem.5b01138. Epub 2015 Dec 17. Biochemistry. 2015. PMID: 26624789
-
Molecular Dynamics Simulations Combined with Nuclear Magnetic Resonance and/or Small-Angle X-ray Scattering Data for Characterizing Intrinsically Disordered Protein Conformational Ensembles.J Chem Inf Model. 2019 May 28;59(5):1743-1758. doi: 10.1021/acs.jcim.8b00928. Epub 2019 Mar 18. J Chem Inf Model. 2019. PMID: 30840442 Review.
-
Simultaneous definition of high resolution protein structure and backbone conformational dynamics using NMR residual dipolar couplings.Chemphyschem. 2007 Sep 17;8(13):1901-9. doi: 10.1002/cphc.200700353. Chemphyschem. 2007. PMID: 17654630 Review.
Cited by
-
You are lost without a map: Navigating the sea of protein structures.Biochim Biophys Acta. 2015 Apr;1854(4):258-68. doi: 10.1016/j.bbapap.2014.12.021. Epub 2014 Dec 29. Biochim Biophys Acta. 2015. PMID: 25554228 Free PMC article. Review.
-
Conformational ensembles of an RNA hairpin using molecular dynamics and sparse NMR data.Nucleic Acids Res. 2020 Feb 20;48(3):1164-1174. doi: 10.1093/nar/gkz1184. Nucleic Acids Res. 2020. PMID: 31889193 Free PMC article.
-
Untangling the complexity of membrane protein folding.Curr Opin Struct Biol. 2022 Feb;72:237-247. doi: 10.1016/j.sbi.2021.11.013. Epub 2022 Jan 5. Curr Opin Struct Biol. 2022. PMID: 34995926 Free PMC article. Review.
-
Expanding the structural biology toolbox with single-molecule holography.Proc Natl Acad Sci U S A. 2017 Feb 14;114(7):1448-1450. doi: 10.1073/pnas.1620897114. Epub 2017 Feb 2. Proc Natl Acad Sci U S A. 2017. PMID: 28154136 Free PMC article. No abstract available.
-
ENCORE: Software for Quantitative Ensemble Comparison.PLoS Comput Biol. 2015 Oct 27;11(10):e1004415. doi: 10.1371/journal.pcbi.1004415. eCollection 2015 Oct. PLoS Comput Biol. 2015. PMID: 26505632 Free PMC article.
References
-
- Berman H. M., Battistuz T., Bhat T. N., Bluhm W. F., Bourne P. E., Burkhardt K., Feng Z., Gilliland G. L., Iype L., Jain S., et al. Acta Crystallogr. D. 2002;58:899–907. - PubMed
-
- Karplus M., McCammon J. A. Nat. Struct. Biol. 2002;9:646–652. - PubMed
-
- Wand A. J. Nat. Struct. Biol. 2001;8:926–931. - PubMed
-
- Palmer A. G., III Chem. Rev. 2004;104:3623–3640. - PubMed
-
- Eisenmesser E. Z., Millet O., Labeikovsky W., Korzhnev D. M., Wolf-Watz M., Bosco D. A., Skalicky J. J., Kay L. E., Kern D. Nature. 2005;438:117–121. - PubMed
Publication types
MeSH terms
Substances
LinkOut - more resources
Full Text Sources

