

Carboxyatractyloside effects on brown-fat mitochondria imply that the adenine nucleotide translocator isoforms ANT1 and ANT2 may be responsible for basal and fatty-acid-induced uncoupling respectively
- PMID: 16831128
- PMCID: PMC1615905
- DOI: 10.1042/BJ20060706
Carboxyatractyloside effects on brown-fat mitochondria imply that the adenine nucleotide translocator isoforms ANT1 and ANT2 may be responsible for basal and fatty-acid-induced uncoupling respectively
Abstract
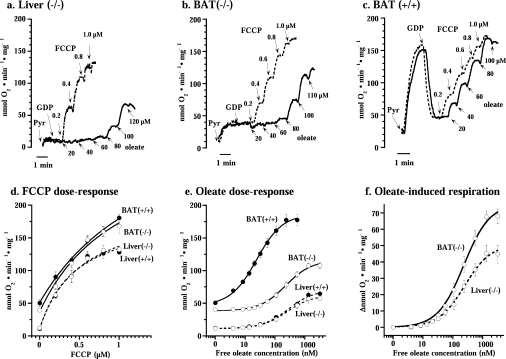
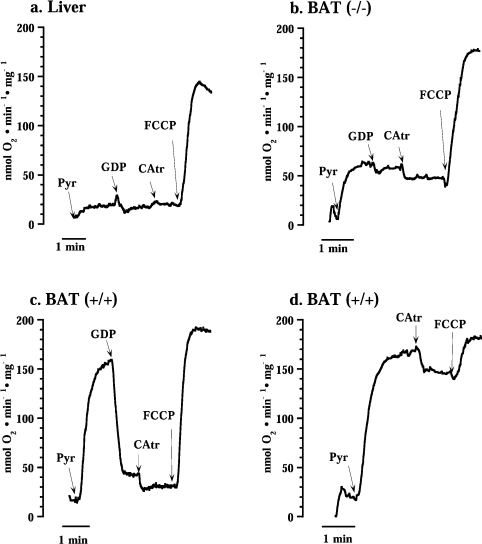
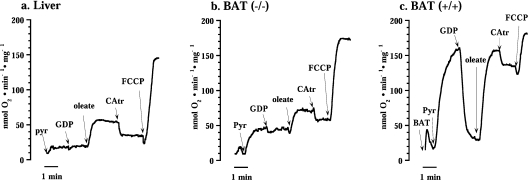
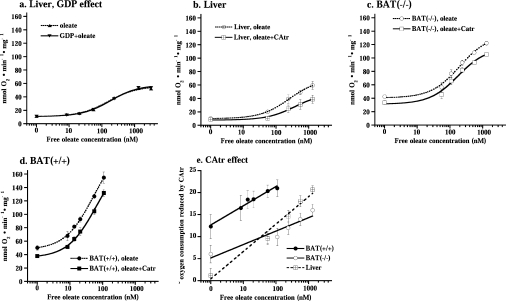
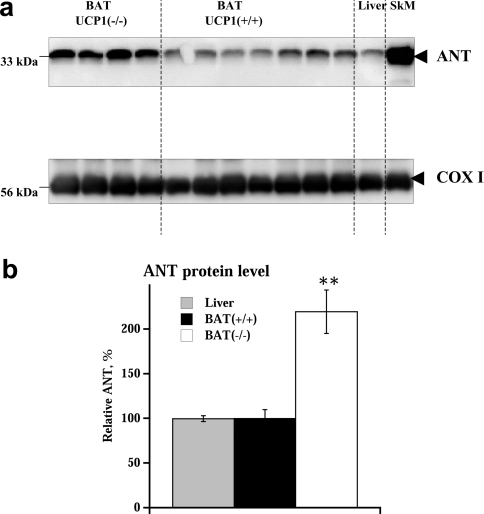
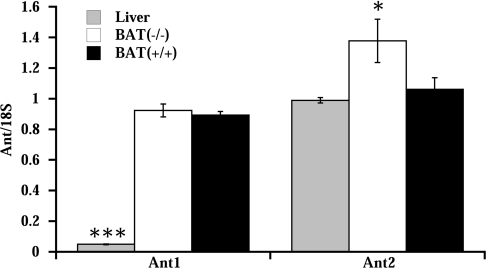
In brown-fat mitochondria, fatty acids induce thermogenic uncoupling through activation of UCP1 (uncoupling protein 1). However, even in brown-fat mitochondria from UCP1-/- mice, fatty-acid-induced uncoupling exists. In the present investigation, we used the inhibitor CAtr (carboxyatractyloside) to examine the involvement of the ANT (adenine nucleotide translocator) in the mediation of this UCP1-independent fatty-acid-induced uncoupling in brown-fat mitochondria. We found that the contribution of ANT to fatty-acid-induced uncoupling in UCP1-/- brown-fat mitochondria was minimal (whereas it was responsible for nearly half the fatty-acid-induced uncoupling in liver mitochondria). As compared with liver mitochondria, brown-fat mitochondria exhibit a relatively high (UCP1-independent) basal respiration ('proton leak'). Unexpectedly, a large fraction of this high basal respiration was sensitive to CAtr, whereas in liver mitochondria, basal respiration was CAtr-insensitive. Total ANT protein levels were similar in brown-fat mitochondria from wild-type mice and in liver mitochondria, but the level was increased in brown-fat mitochondria from UCP1-/- mice. However, in liver, only Ant2 mRNA was found, whereas in brown adipose tissue, Ant1 and Ant2 mRNA levels were equal. The data are therefore compatible with a tentative model in which the ANT2 isoform mediates fatty-acid-induced uncoupling, whereas the ANT1 isoform may mediate a significant part of the high basal proton leak in brown-fat mitochondria.
Figures
Similar articles
-
Uncoupling protein-1 is not leaky.Biochim Biophys Acta. 2010 Jun-Jul;1797(6-7):773-84. doi: 10.1016/j.bbabio.2010.04.007. Epub 2010 Apr 14. Biochim Biophys Acta. 2010. PMID: 20399195
-
Thermogenic responses in brown fat cells are fully UCP1-dependent. UCP2 or UCP3 do not substitute for UCP1 in adrenergically or fatty scid-induced thermogenesis.J Biol Chem. 2000 Aug 18;275(33):25073-81. doi: 10.1074/jbc.M000547200. J Biol Chem. 2000. PMID: 10825155
-
Cold tolerance of UCP1-ablated mice: a skeletal muscle mitochondria switch toward lipid oxidation with marked UCP3 up-regulation not associated with increased basal, fatty acid- or ROS-induced uncoupling or enhanced GDP effects.Biochim Biophys Acta. 2010 Jun-Jul;1797(6-7):968-80. doi: 10.1016/j.bbabio.2010.02.033. Epub 2010 Mar 19. Biochim Biophys Acta. 2010. PMID: 20227385
-
UCP1: the only protein able to mediate adaptive non-shivering thermogenesis and metabolic inefficiency.Biochim Biophys Acta. 2001 Mar 1;1504(1):82-106. doi: 10.1016/s0005-2728(00)00247-4. Biochim Biophys Acta. 2001. PMID: 11239487 Review.
-
Meaningful respirometric measurements of UCP1-mediated thermogenesis.Biochimie. 2017 Mar;134:56-61. doi: 10.1016/j.biochi.2016.12.005. Epub 2016 Dec 14. Biochimie. 2017. PMID: 27986537 Review.
Cited by
-
Acute knockdown of uncoupling protein-2 increases uncoupling via the adenine nucleotide transporter and decreases oxidative stress in diabetic kidneys.PLoS One. 2012;7(7):e39635. doi: 10.1371/journal.pone.0039635. Epub 2012 Jul 2. PLoS One. 2012. PMID: 22768304 Free PMC article.
-
Human 'brite/beige' adipocytes develop from capillary networks, and their implantation improves metabolic homeostasis in mice.Nat Med. 2016 Mar;22(3):312-8. doi: 10.1038/nm.4031. Epub 2016 Jan 25. Nat Med. 2016. PMID: 26808348 Free PMC article.
-
Antioxidant Synergy of Mitochondrial Phospholipase PNPLA8/iPLA2γ with Fatty Acid-Conducting SLC25 Gene Family Transporters.Antioxidants (Basel). 2021 Apr 26;10(5):678. doi: 10.3390/antiox10050678. Antioxidants (Basel). 2021. PMID: 33926059 Free PMC article. Review.
-
Inflammation in obesity, diabetes, and related disorders.Immunity. 2022 Jan 11;55(1):31-55. doi: 10.1016/j.immuni.2021.12.013. Immunity. 2022. PMID: 35021057 Free PMC article. Review.
-
Nucleoside diphosphate kinase strongly promotes GDP and ADP metabolism in the cell and affects endogenous proton leak in mitochondria - the kinase is hampered by oxidative phosphorylation inhibitors.J Enzyme Inhib Med Chem. 2025 Dec;40(1):2520611. doi: 10.1080/14756366.2025.2520611. Epub 2025 Jul 17. J Enzyme Inhib Med Chem. 2025. PMID: 40673704 Free PMC article.
References
-
- Nicholls D. G., Locke R. M. Thermogenic mechanisms in brown fat. Physiol. Rev. 1984;64:1–64. - PubMed
-
- Nedergaard J., Golozoubova V., Matthias A., Asadi A., Jacobsson A., Cannon B. UCP1: the only protein able to mediate adaptive non-shivering thermogenesis and metabolic inefficiency. Biochim. Biophys. Acta. 2001;1504:82–106. - PubMed
-
- Cannon B., Nedergaard J. Brown adipose tissue: function and physiological significance. Physiol. Rev. 2004;84:277–359. - PubMed
-
- Skulachev V. P. Uncoupling: new approaches to an old problem of bioenergetics. Biochim. Biophys. Acta. 1998;1363:100–124. - PubMed
-
- Wojtczak L., Wieckowski M. R., Schönfeld P. Protonophoric activity of fatty acid analogs and derivatives in the inner mitochondrial membrane: a further argument for the fatty acid cycling model. Arch. Biochem. Biophys. 1998;357:76–84. - PubMed
Publication types
MeSH terms
Substances
LinkOut - more resources
Full Text Sources
Molecular Biology Databases
Research Materials