

Imaging peptidoglycan biosynthesis in Bacillus subtilis with fluorescent antibiotics
- PMID: 16832063
- PMCID: PMC1544169
- DOI: 10.1073/pnas.0600829103
Imaging peptidoglycan biosynthesis in Bacillus subtilis with fluorescent antibiotics
Abstract
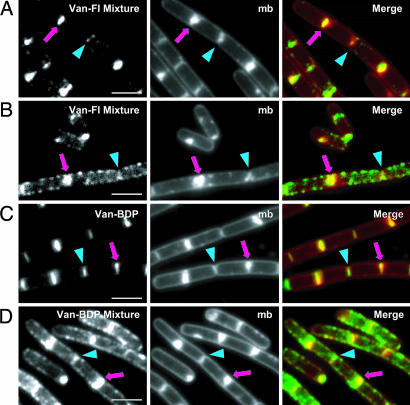
The peptidoglycan (PG) layers surrounding bacterial cells play an important role in determining cell shape. The machinery controlling when and where new PG is made is not understood, but is proposed to involve interactions between bacterial actin homologs such as Mbl, which forms helical cables within cells, and extracellular multiprotein complexes that include penicillin-binding proteins. It has been suggested that labeled antibiotics that bind to PG precursors may be useful for imaging PG to help determine the genes that control the biosynthesis of this polymer. Here, we compare the staining patterns observed in Bacillus subtilis using fluorescent derivatives of two PG-binding antibiotics, vancomycin and ramoplanin. The staining patterns for both probes exhibit a strong dependence on probe concentration, suggesting antibiotic-induced perturbations in PG synthesis. Ramoplanin probes may be better imaging agents than vancomycin probes because they yield clear staining patterns at concentrations well below their minimum inhibitory concentrations. Under some conditions, both ramoplanin and vancomycin probes produce helicoid staining patterns along the cylindrical walls of B. subtilis cells. This sidewall staining is observed in the absence of the cytoskeletal protein Mbl. Although Mbl plays an important role in cell shape determination, our data indicate that other proteins control the spatial localization of the biosynthetic complexes responsible for new PG synthesis along the walls of B. subtilis cells.
Conflict of interest statement
Conflict of interest statement: No conflicts declared.
Figures


References
-
- Archibald A. R., Hancock I. C., Harwood C. R. In: Bacillus subtilis and Other Gram-Positive Bacteria, Biochemistry, Physiology, and Molecular Genetics, Hoch J. A., Losick R., editors. Washington, DC: Am. Soc. Microbiol; 1993. pp. 381–410.
-
- Walsh C. Antibiotics: Actions, Origins, Resistance. Washington, DC: Am. Soc. Microbiol; 2003.
-
- Young K. D. Mol. Microbiol. 2003;49:571–580. - PubMed
-
- Popham D. L., Young K. D. Curr. Opin. Microbiol. 2003;6:594–599. - PubMed
Publication types
MeSH terms
Substances
Grants and funding
LinkOut - more resources
Full Text Sources
Other Literature Sources
Miscellaneous
